Figure 7.
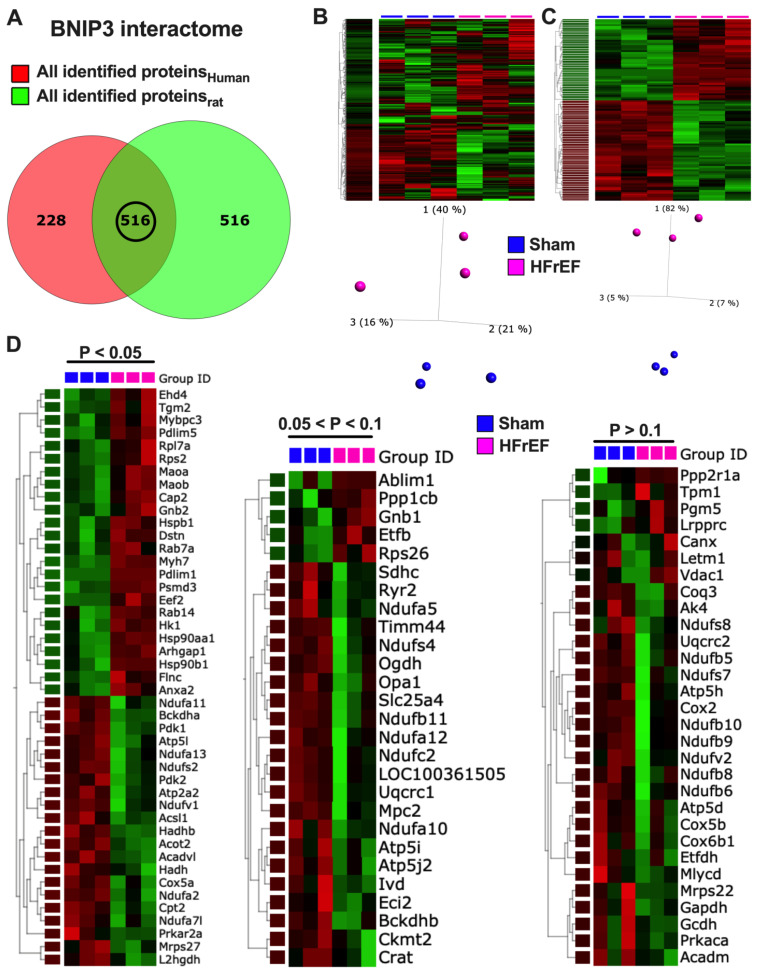
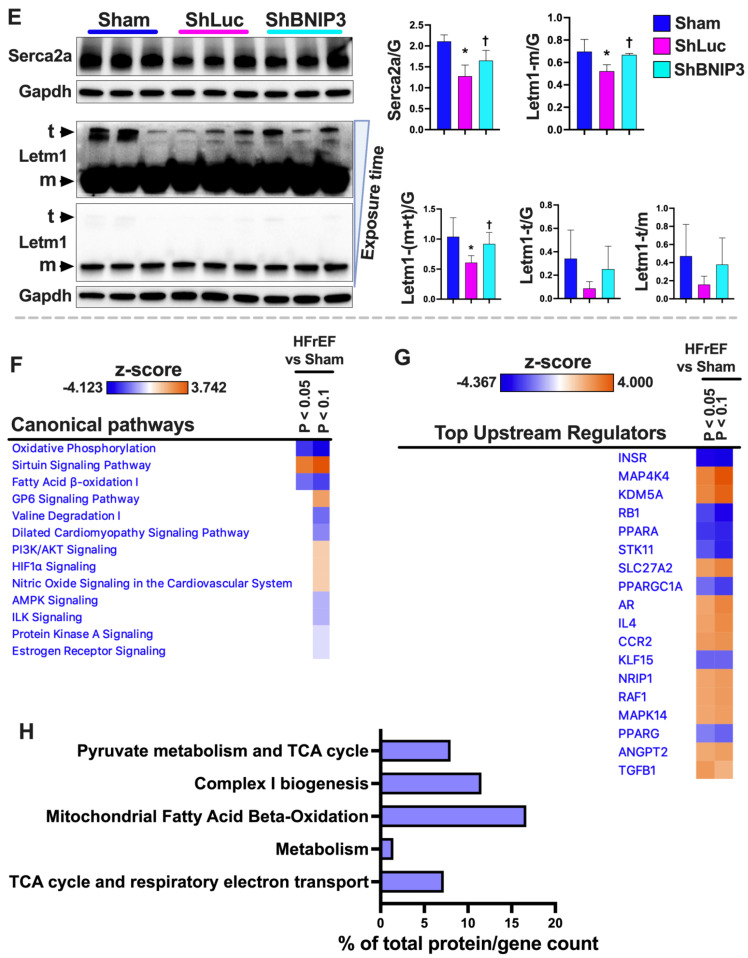
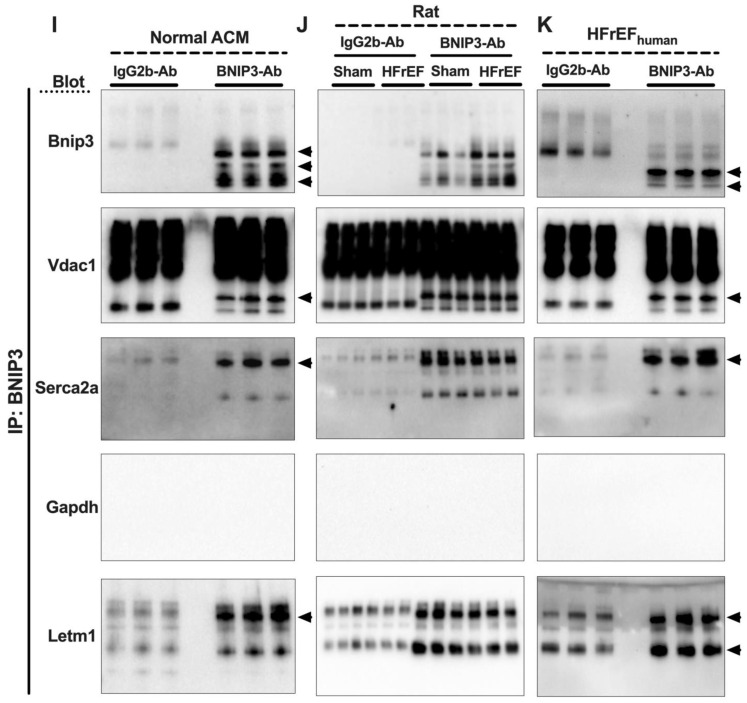
BNIP3 interactome in human and rat LV myocardia identified via BNIP3 co-immunoprecipitation (Co-IP) and mass spectrometry. (A). Venn diagrams show the total number of identified BNIP3 interacting proteins by mass spectrometry in the human (red) and rat (green) HFrEF LV myocardium. The intersection between the two Venn diagrams (black circle) shows the number of commonly identified BNIP3 interacting proteins in human and rat samples. (B,C). Heat maps and PCA plots show the relative log2-fold expression and the variance in biological samples, respectively, in Sham and HFrEF in the rat LV myocardium of the 516 common identified BNIP3 interacting proteins (left), including those that were differentially expressed in HFrEF vs. Sham, taking a cutoff p-value of <0.05 (right). (D). Heat maps show the relative log2-fold expression in Sham and HFrEF in the rat LV myocardium of some of the important identified BNIP3 interacting proteins that were commonly identified in rat and human HFrEF samples, presented by HFrEF vs. Sham cutoff p-value < 0.05 (left), 0.05 < p < 0.1 (middle), and p > 0.1 (right). (E). Western blot showing the expression of sarco/endoplasmic reticulum calcium ATPase 2a (SERCA2a) and the mt-proton/calcium exchanger protein (LETM1) in Sham, ShLuc, and ShBNIP3, * p < 0.05 vs. Sham and † p < 0.05 vs. ShLuc; m, monomer; t, trimer. (F,G). Heat maps of the top Canonical Pathways and Upstream Regulators that were upregulated/activated or downregulated/inhibited in HFrEF vs. Sham rat samples. The orange and blue color intensities represent the z-score-based extent of upregulation/activation or downregulation/inhibition, respectively. The heat maps were generated in IPA after “Core Analyses” of each of the two-group comparisons (HFrEF vs. Sham), taking a cutoff p-value of <0.05 vs. <0.1, which were then compared with each other in IPA’s “Comparison Analyses” function. (H). BNIP3 interactome enriched metabolic reactome pathways, by q-value, that were attenuated (blue bars) in HFrEF vs. Sham. Data are presented as percentage of total protein count per reactome pathway. (I–K). Validation of some of the BNIP3 interacting proteins by Co-IP and western blot in Normal ACM (I), Rat LV myocardium, Sham vs. HFrEF (J), and human HFrEF LV myocardium (K).


