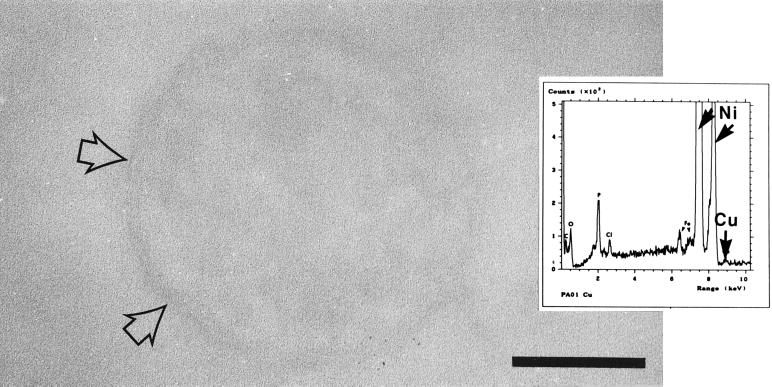
FIG. 3.
Transmission electron micrograph of a copper-treated strain PAO1 cell. Compared to the control, this cell was easier to distinguish as copper bound to it and provided contrast at the cell surface (arrows). Bar = 200 nm. (Inset) EDS spectrum generated by a copper-treated cell. The expected position of the copper peak is indicated, although the peak itself is small. The large nickel peaks were generated by the supporting grid, and all of the other peaks (O, P, Cl, and Fe) were also present in controls. Similar results were obtained for all four strains.

