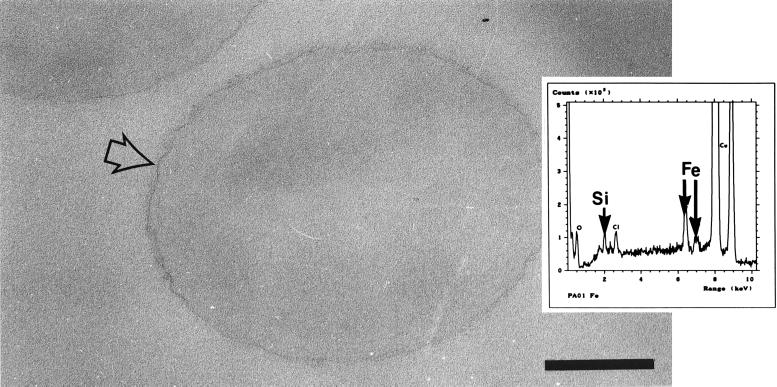
FIG. 4.
Transmission electron micrograph of an iron-treated strain PAO1 cell. The iron bound to the cell surface, providing increased electron density. In addition, the cell surface appeared to be ruffled in some areas (arrow). Bar = 200 nm. (Inset) EDS spectrum for the surface of an iron-treated cell, showing large iron peaks and the presence of silicon (probably from the glassware), which suggested that binding of the metal was accompanied by binding of silicon. Similar results were obtained for all of the strains except dps89.

