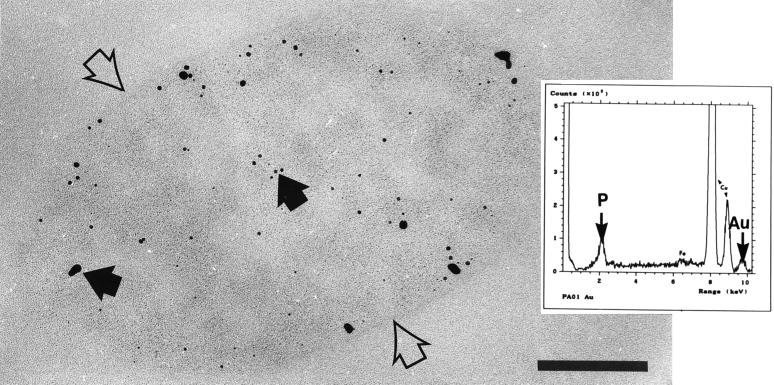
FIG. 6.
Thin section of a gold-treated strain PAO1 cell. The cell (whose surface is indicated by open arrows) is filled with numerous electron-dense precipitates of different sizes (solid arrows). Bar = 200 nm. (Inset) EDS analysis of the electron-dense precipitates produced only a peak for gold and a broadening of the phosphorus peak (which overlapped a secondary gold peak). Similar results were obtained for all four strains.

