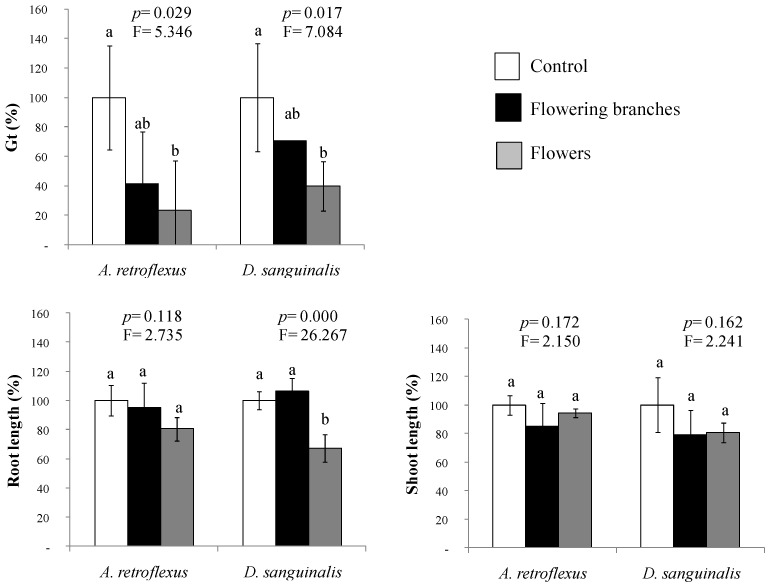
Figure 2.
Effects of a mixture of phenolic compounds, prepared by mimicking the aqueous extract of Cytisus scoparius flowering foliage or only flowers, applied in Petri dishes on the total percentage of germinated seeds (Gt) and early growth of two agricultural weed species (Amaranthus retroflexus and Digitaria sanguinalis). Mean values of four replicates are represented in percentage relative to control. Error bars represent standard deviation (S.D.). For each target species, p- and F-values of the effects of treatments from one-way ANOVA or Kruskal-Wallis H tests are shown. Mean values labeled with distinct letters denote statistically significant differences among treatments (post hoc LSD or Tamhane’s T2 test).

