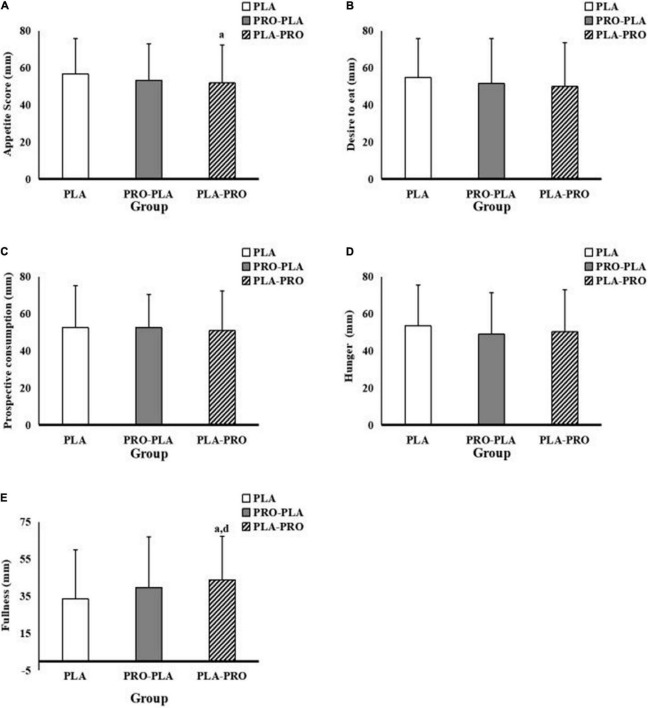
FIGURE 5.
Appetite scores in PLA, PRO-PLA, and PLA-PRO (unit: mm). (A) The appetite score. (B) Desire to eat. (C) Prospective consumption. (D) Hunger. (E) Fullness. ap < 0.05 PLA-PRO VS PLA, adjusted for age, sex, %fat, relativeVO2max sleep quality, the time of sedentary behavior and moderate and vigorous intensity physical activity in the pre-experiment stage, resistance energy expenditure under each condition (model 1); dp < 0.05 PLA-PRO VS PLA, additionally adjusted for 24-h total energy intake based on model 1 (model 2).

