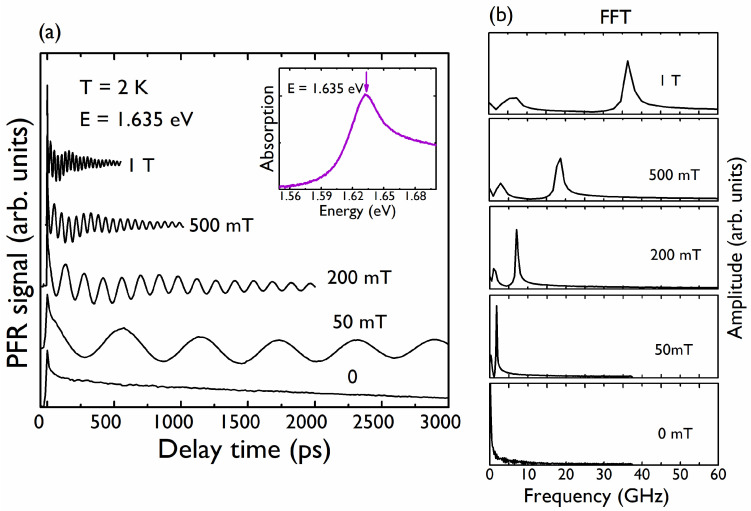
Figure 2.
(a) PFR signals at 2 K for different magnetic fields. The curves have been shifted for clarity. The magnetic field is perpendicular to the propagation direction of the pump and probe beams ( = 0°). Inset: Absorption spectrum on MAPI sample obtained at 11 K. The arrow denotes the energy at which the PFR measurements were performed; (b) FFT of the PFR signals appearing in (a).

