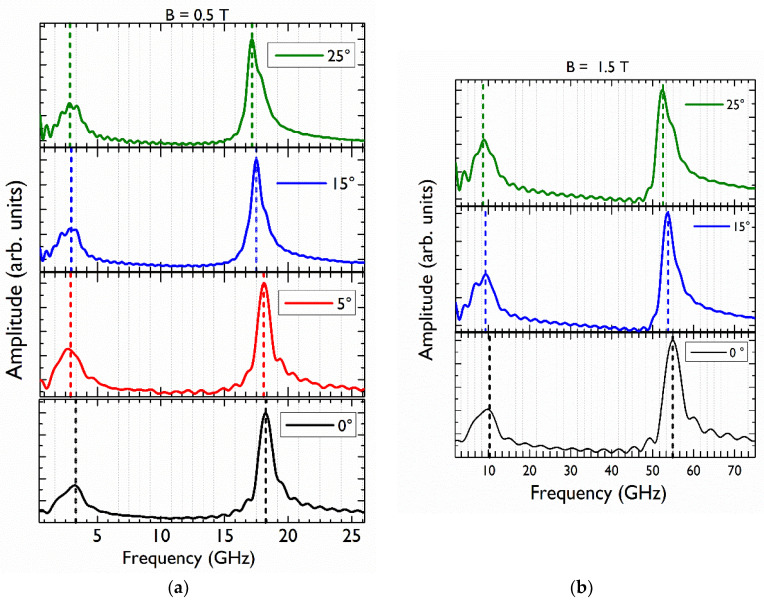
Figure 5.
(a) FFT of the PFR signals appearing in Figure 4 obtained at a fixed magnetic field B = 0.5 T and different angles 0° (black), 5° (red), 15° (blue), 25° (green). The curves have been vertically shifted for clarity. The vertical dashed lines indicate the two identified frequencies corresponding to the hole and electron in each case. (b) FFT of the PFR signals obtained at B = 1.5 T. The decrease in the frequencies as the angle increases is indicated with the dashed lines.

