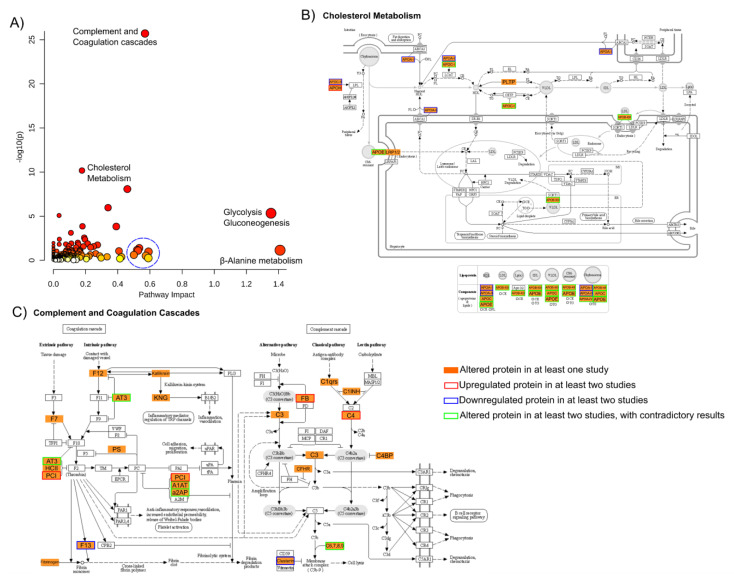
Figure 6.
Gene ontology analysis of all proteins considered altered throughout the analyzed reports. A gene ontology approach was used to assess pathway impact and enrichment (here presented by the p-value and color scheme in (A)) of all proteins described as altered between controls and SCZ in at least one study (Supplementary Information, Table S2), represented here as a scatter plot [60]. The blue circle highlights a cluster of ontologies, all belonging to metabolic pathways. From the pathways shown as enriched by this list of proteins, two were selected and their visual representation was obtained through the KEGG Mapper Color tool [61,62]: (B) cholesterol metabolism and (C) complement and coagulation cascades. In these KEGG panels, the proteins found in any of the studies are shown in orange, and proteins found to be altered in at least two studies are highlighted in red or blue when the protein is always found to be up- or down-regulated in SCZ cases (respectively) or highlighted in green when the results from the two or more studies are contradictory.

