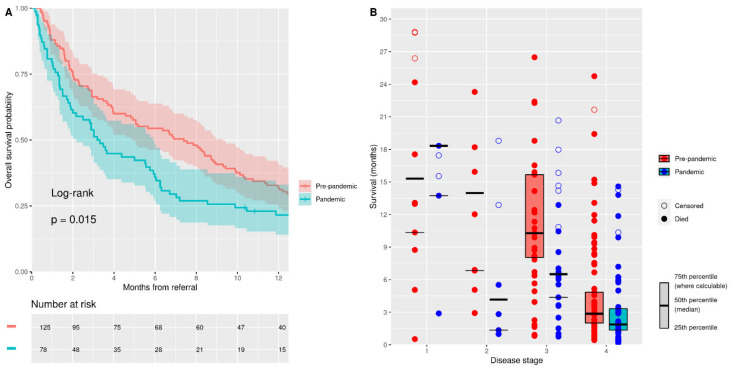
Figure 2.
Survival analysis (all causes of mortality) from referral. (A) Kaplan–Meier plot of survival from referral (all disease stages at diagnosis). (B) Box plot of survival from referral in “pandemic” and “pre-pandemic” cohorts by disease stage at diagnosis. Individual cases plotted and IQR shown where the 75th percentile is calculable.

