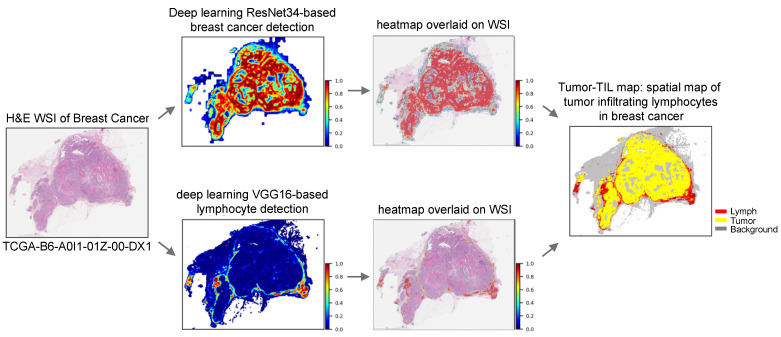
Figure 1.
Machine learning and computer vision in computational pathology to spatially map tumor-infiltrating lymphocytes (TILs) in breast cancer. Top panels show tumor detection presented as a spatial probability heatmap to evaluate algorithmic performance (non-tumor tissue colored blue), which is then overlaid on the original H&E WSI. Bottom panels show automated lymphocyte detection presented as a spatial probability heatmap (non-lymphocyte tissue colored blue) and then overlaid on the original H&E WSI. Combining the outputs of tumor and lymphocyte detection generates Tumor-TIL maps to evaluate the abundance and spatial distribution of peritumoral and intratumoral TILs (tumor colored yellow, lymphocytes colored red, and background non-tumor/non-lymphocyte tissue colored gray). This Tumor-TIL map shows the presence of peritumoral TILs with a paucity of intratumoral TIL infiltrates. Image: BRCA TCGA-B6-A0I1-01Z-00-DX1, high-grade breast cancer; cancer detection with ResNet model; lymphocyte detection with VGG16 model.

