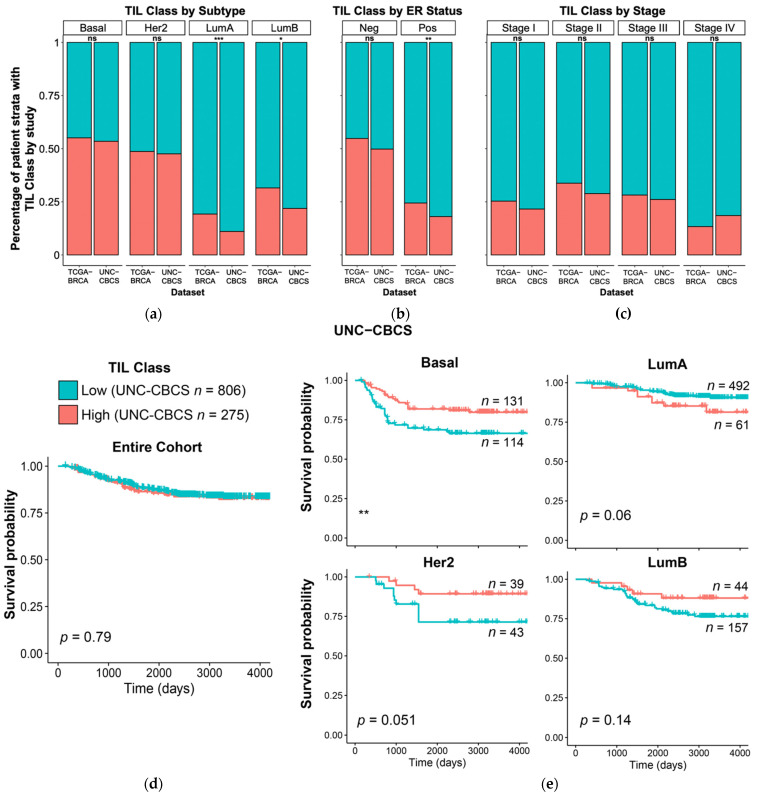
Figure 4.
Comparison of computed intratumoral TIL infiltrate percentage in TCGA BRCA and UNC CBCS and relationship to progression-free interval (PFI). The median TIL infiltrate percentage was computed for each study to distinguish cases as high or low TIL class; percent infiltration was determined using VGG TIL detection algorithm. (a–c) Percentage of patient strata classified as high and low TILs is shown for the TCGA BRCA and UNC CBCS studies grouped by (a) PAM50 molecular subtype, (b) estrogen receptor (ER) status, and (c) tumor stage. Blue denotes TIL class Low and Red denotes TIL class High. (d,e) Kaplan–Meier plots to show disease progression in the UNC CBCS cohort after dividing patients into high and low TIL classes around the mean TIL infiltrate percentage for the (d) entire UNC CBCS cohort and (e) cases split by PAM50 molecular subtype. Log-rank test was used to assess survival differences. *** = p < 0.001, ** = p < 0.05, * = p < 0.01.

