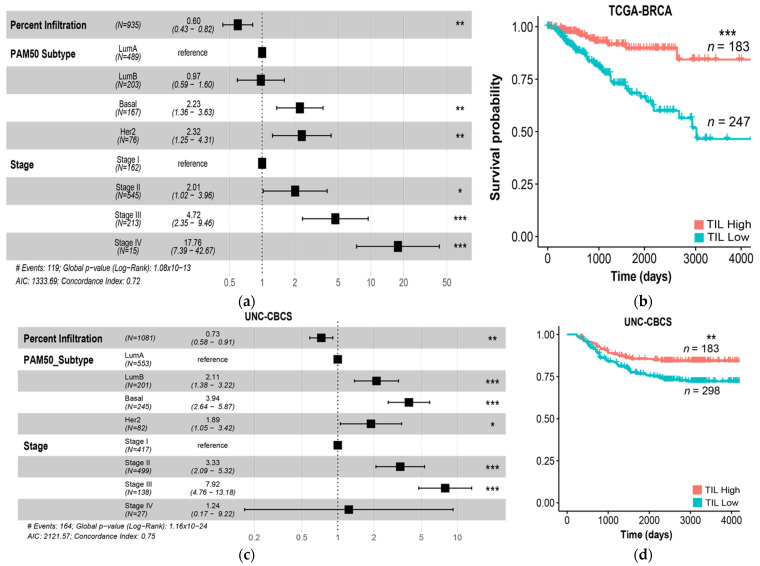
Figure 5.
TIL infiltration remains strongly predictive of survival across TCGA BRCA and UNC CBCS. (a) Forest plots of hazard ratios (estimates and 95% CIs) from a multivariate Cox proportional hazards model of progression-free interval (PFI) incorporating PAM50 subtype and tumor stage. Vertical dotted line indicates a hazard ratio of 1. TIL infiltrate percentage ranges from 0% to 64.2% with SD of 10.4%. TIL infiltrate percentage is scaled by SD for all Cox Regression Analyses. (b) Kaplan–Meier survival analyses of TCGA BRCA patients after splitting into high and low TIL classes around the mean percent infiltration. (c) Forest plot of hazard ratios from a multivariate Cox proportional hazards model of PFI in the UNC CBCS including PAM50 subtype and tumor stage. TIL infiltration was calculated as a continuous variable with a range of 0% to 88.9% and scaled by SD (0.1), AIC: 2121.57. The dotted line indicates a hazard ratio of 1. The Concordance Index shows how much variance of risk is explained by the model, where 1 encapsulates all risk whereas 0.5 is random. (d) Kaplan–Meier survival analyses after dividing UNC CBCS patients into high and low TIL infiltration groups around the mean TIL infiltrate percentage. *** = p < 0.001, ** = p < 0.05, * = p < 0.01.

