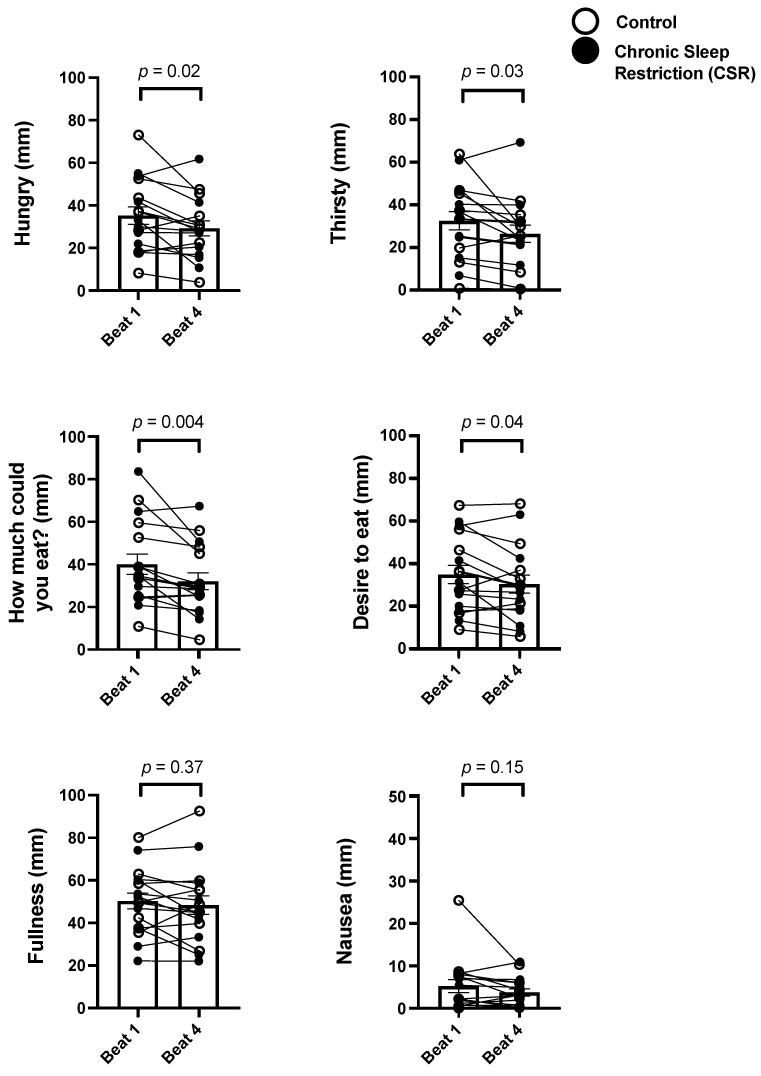
Figure 2.
Chronic impact of circadian disruption on subjective hunger and appetite. Data from the Control (n = 8, 1:2 sleep:wake ratio) participants are denoted by open circles and those from the Chronic Sleep Restriction (CSR, n = 9, 1:3.3 sleep:wake ratio) participants are denoted by closed circles. Higher scores indicate higher subjective feelings of each aspect of hunger and appetite. Beat cycles (i.e., time to complete a cycle of circadian and sleep:wake schedule combinations, which was ~6 protocol days in this forced desynchrony design) of the protocol are shown on the x-axis. Group means are each beat cycle are denoted by the open column and error bars represent SEM. Note, the y-axis of Nausea is approximately one-half the range of the others. p values are derived from independent t-tests used to test differences between Beat cycle 1 and Beat cycle 4.

