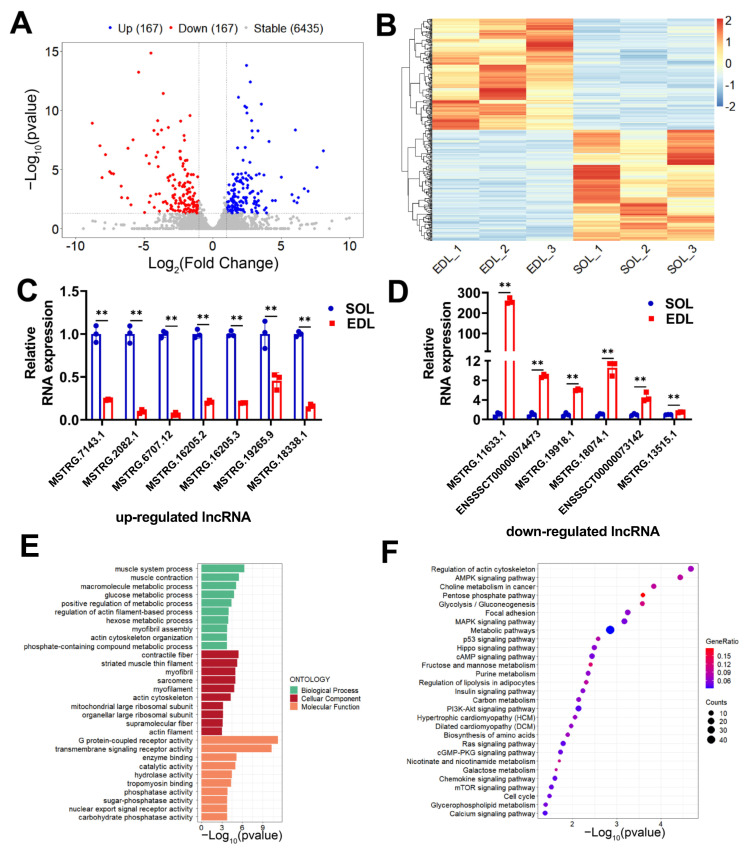
Figure 3.
Screening and functional enrichment analysis of DE lncRNAs in SOL compared with EDL. (A) Volcano plot showing the expression profile of DE lncRNAs between SOL and EDL. Blue dots \\SOL; grey dots represent lncRNAs with stable expression in both tissues. (B) Hierarchical clustering heatmap showing the expression profile of DE lncRNAs between SOL and EDL. (C,D) 7 upregulated (C) and 6 downregulated (D) DE lncRNAs were randomly selected and verified via qPCR. (E) GO enrichment analysis of the nearest target genes of DE lncRNAs. (F) KEGG pathway analysis of the nearest target genes of DE lncRNAs. The relative RNA expressions were standardized to that of the control gene β-actin. Data represent mean ± SD of three independent biological replicates. ** p < 0.01.

