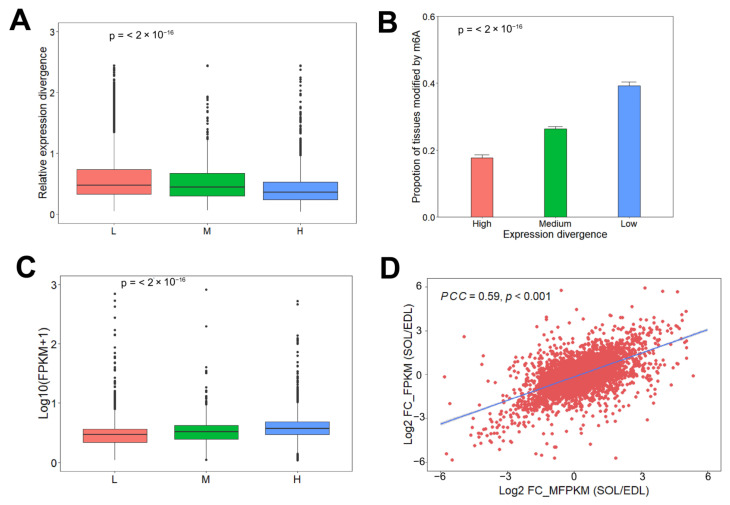
Figure 5.
Association analysis of m6A with lncRNAs expression. (A) Relative expression divergence of lncRNAs in the L set (4596 lncRNAs), M set (639 lncRNAs) and H set (1534 lncRNAs). Significance was evaluated by a two-sided Mann–Kendall trend test, p < 2.2 × 10⁻¹⁶. (B) The lncRNAs were clustered into Low (1693 lncRNAs), Median (3383 lncRNAs), and High (1693 lncRNAs) groups according to the quantile of the expression divergence. Significance was evaluated by a two-sided Mann–Kendall trend test, p < 2.2 × 10⁻¹⁶. (C) Expression level in lncRNAs in the L set (4596 lncRNAs), M set (639 lncRNAs) and H set (1534 lncRNAs). Significance was evaluated by a two-sided Mann–Kendall trend test, p < 2.2 × 10⁻¹⁶. (D) Scatter plot showing the positive correlation between m6A levels and expression level of lncRNAs between EDL and SOL. FC: Fold change; PCC: Pearson correlation coefficient.

