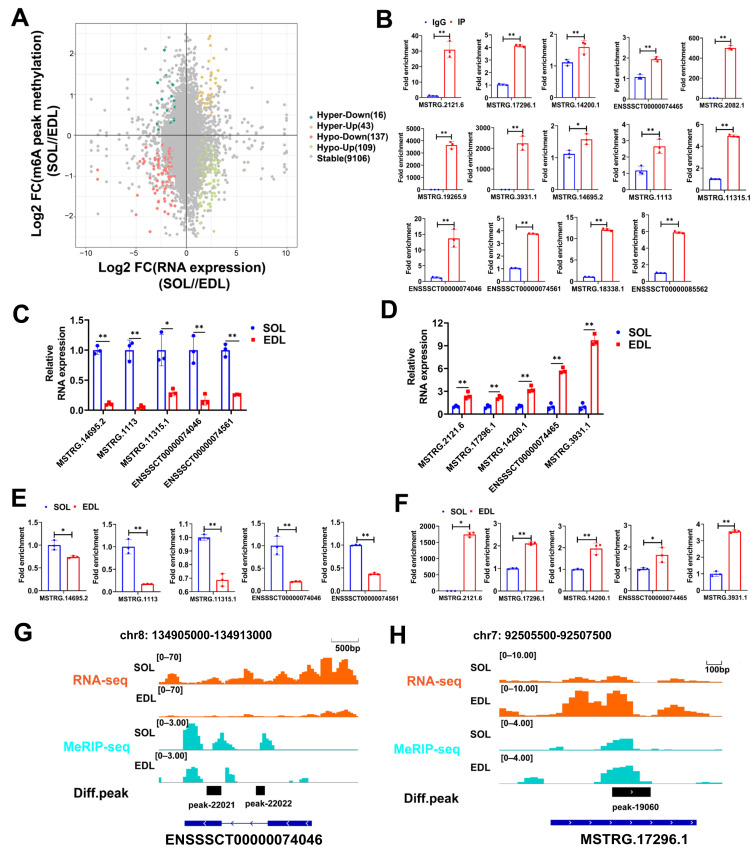
Figure 6.
Conjoint Analyses of MeRIP-Seq and RNA-Seq Data. (A) Four-quadrant graph showing the distribution of lncRNAs with a marked change in both RNA expressions and m6A methylation levels in SOL compared with EDL. Different colors were used to identify representative lncRNAs. (B) MeRIP-qPCR validated 14 m6A-methylated lncRNAs. IgG was used as negative control. (C,D) MeRIP-qPCR results showed that 5 Hyper-Up lncRNAs of the 14 m6A-methylated lncRNAs have higher m6As enrichment in SOL than EDL (C), 5 Hypo-Down lncRNAs of the 14 m6A-methylated lncRNAs have higher m6As enrichment in EDL than SOL (D); data were normalized by IgG. (E) qPCR results showed that the expression of 5 Hyper-Up lncRNAs were increased in SOL compared with EDL. (F) qPCR results showed that the expression of 5 Hypo-Down lncRNAs were decreased in SOL compared with EDL. (G,H) Genome browser tracks showing RNA-seq (orange) and MeRIP-seq (light blue) data at lncRNA ENSSSCT00000074046 (G, scale bar: 500 bp) and MSTRG. 17296.1 (H, scale bar: 100 bp) loci in SOL and EDL. The relative RNA expressions were standardized to that of the control gene β-actin. Data represent mean ± SD of three independent biological replicates. * p < 0.05; ** p < 0.01.

