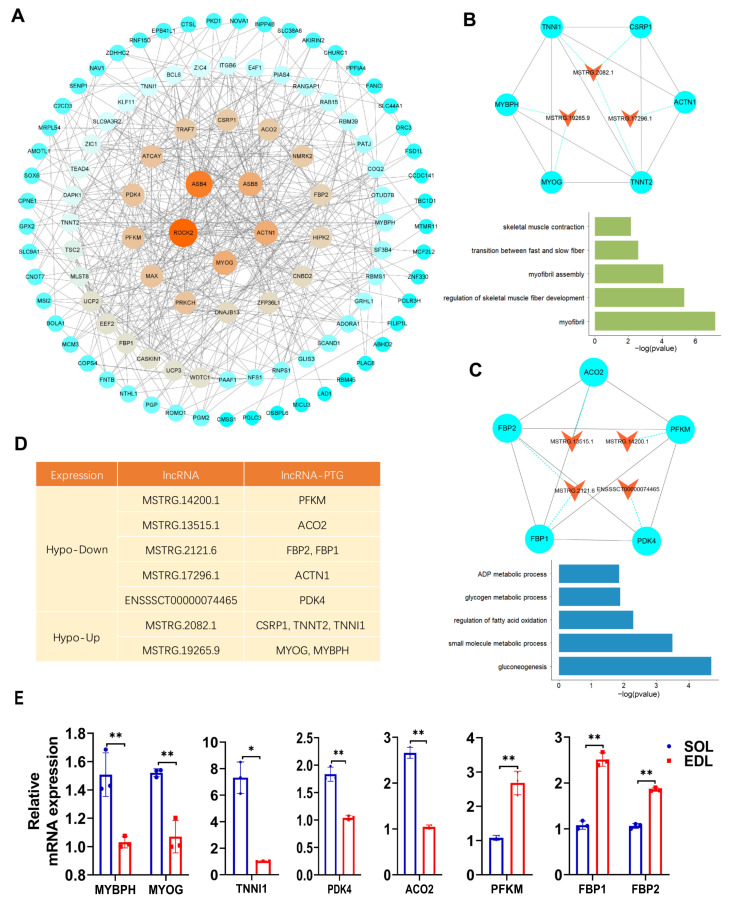
Figure 7.
QTL analysis and functional enrichment of dme-lncRNAs. (A) Protein–protein interaction (PPI) network of PTGs of lncRNAs visualized by using Cytoscape. The size and color of circles represented the degree of interaction between the genes. (B,C) Above: the top two clusters from PPI network identified by using MCODE. Bottom: GO enrichment analysis of PTGs in corresponding cluster. The orange triangle node represented lncRNAs, the blue cycle node represented PTGs. Each pair of PTGs and lncRNAs was indicated by blue dotted line. The interaction of PTGs was indicated by black solid line. (D) The information of lncRNAs and their adjacent mRNAs from (E). (E) qPCR result showing the adjacent mRNA expressions in SOL and EDL. The relative mRNA expression was standardized to that of the control gene β-actin. Data represent mean ± SD of three independent biological replicates. * p< 0.05; ** p < 0.01.

