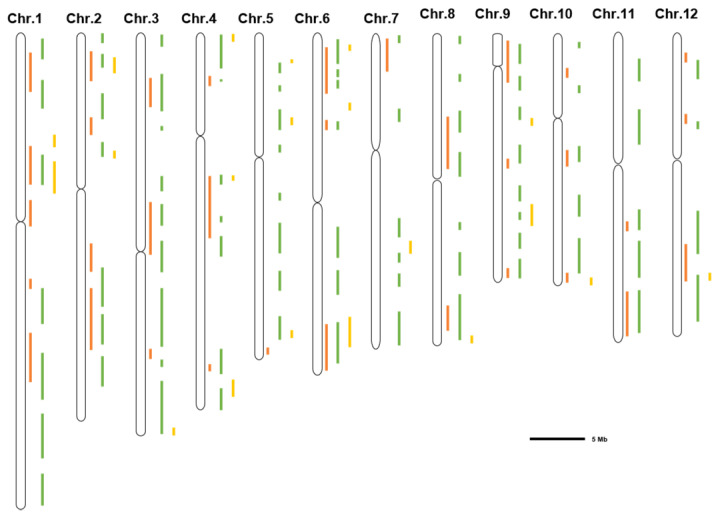
Figure 1.
Distribution of salt stress-related QTLs/QTNs detected by GWAS on 12 chromosomes (Chr) of rice. The 12 long columns represent the 12 chromosomes of rice, respectively. The orange, green and yellow bars represent QTLs/QTNs positions detected at the stages of germination [31,32,33,34], seedling [34,35,36,37,38,40,41,42,43,45,46,51,52] and reproductive [47,48,49,50], respectively. The length of the black line in the lower right corner of the figure represents the physical distance of the chromosomes.

