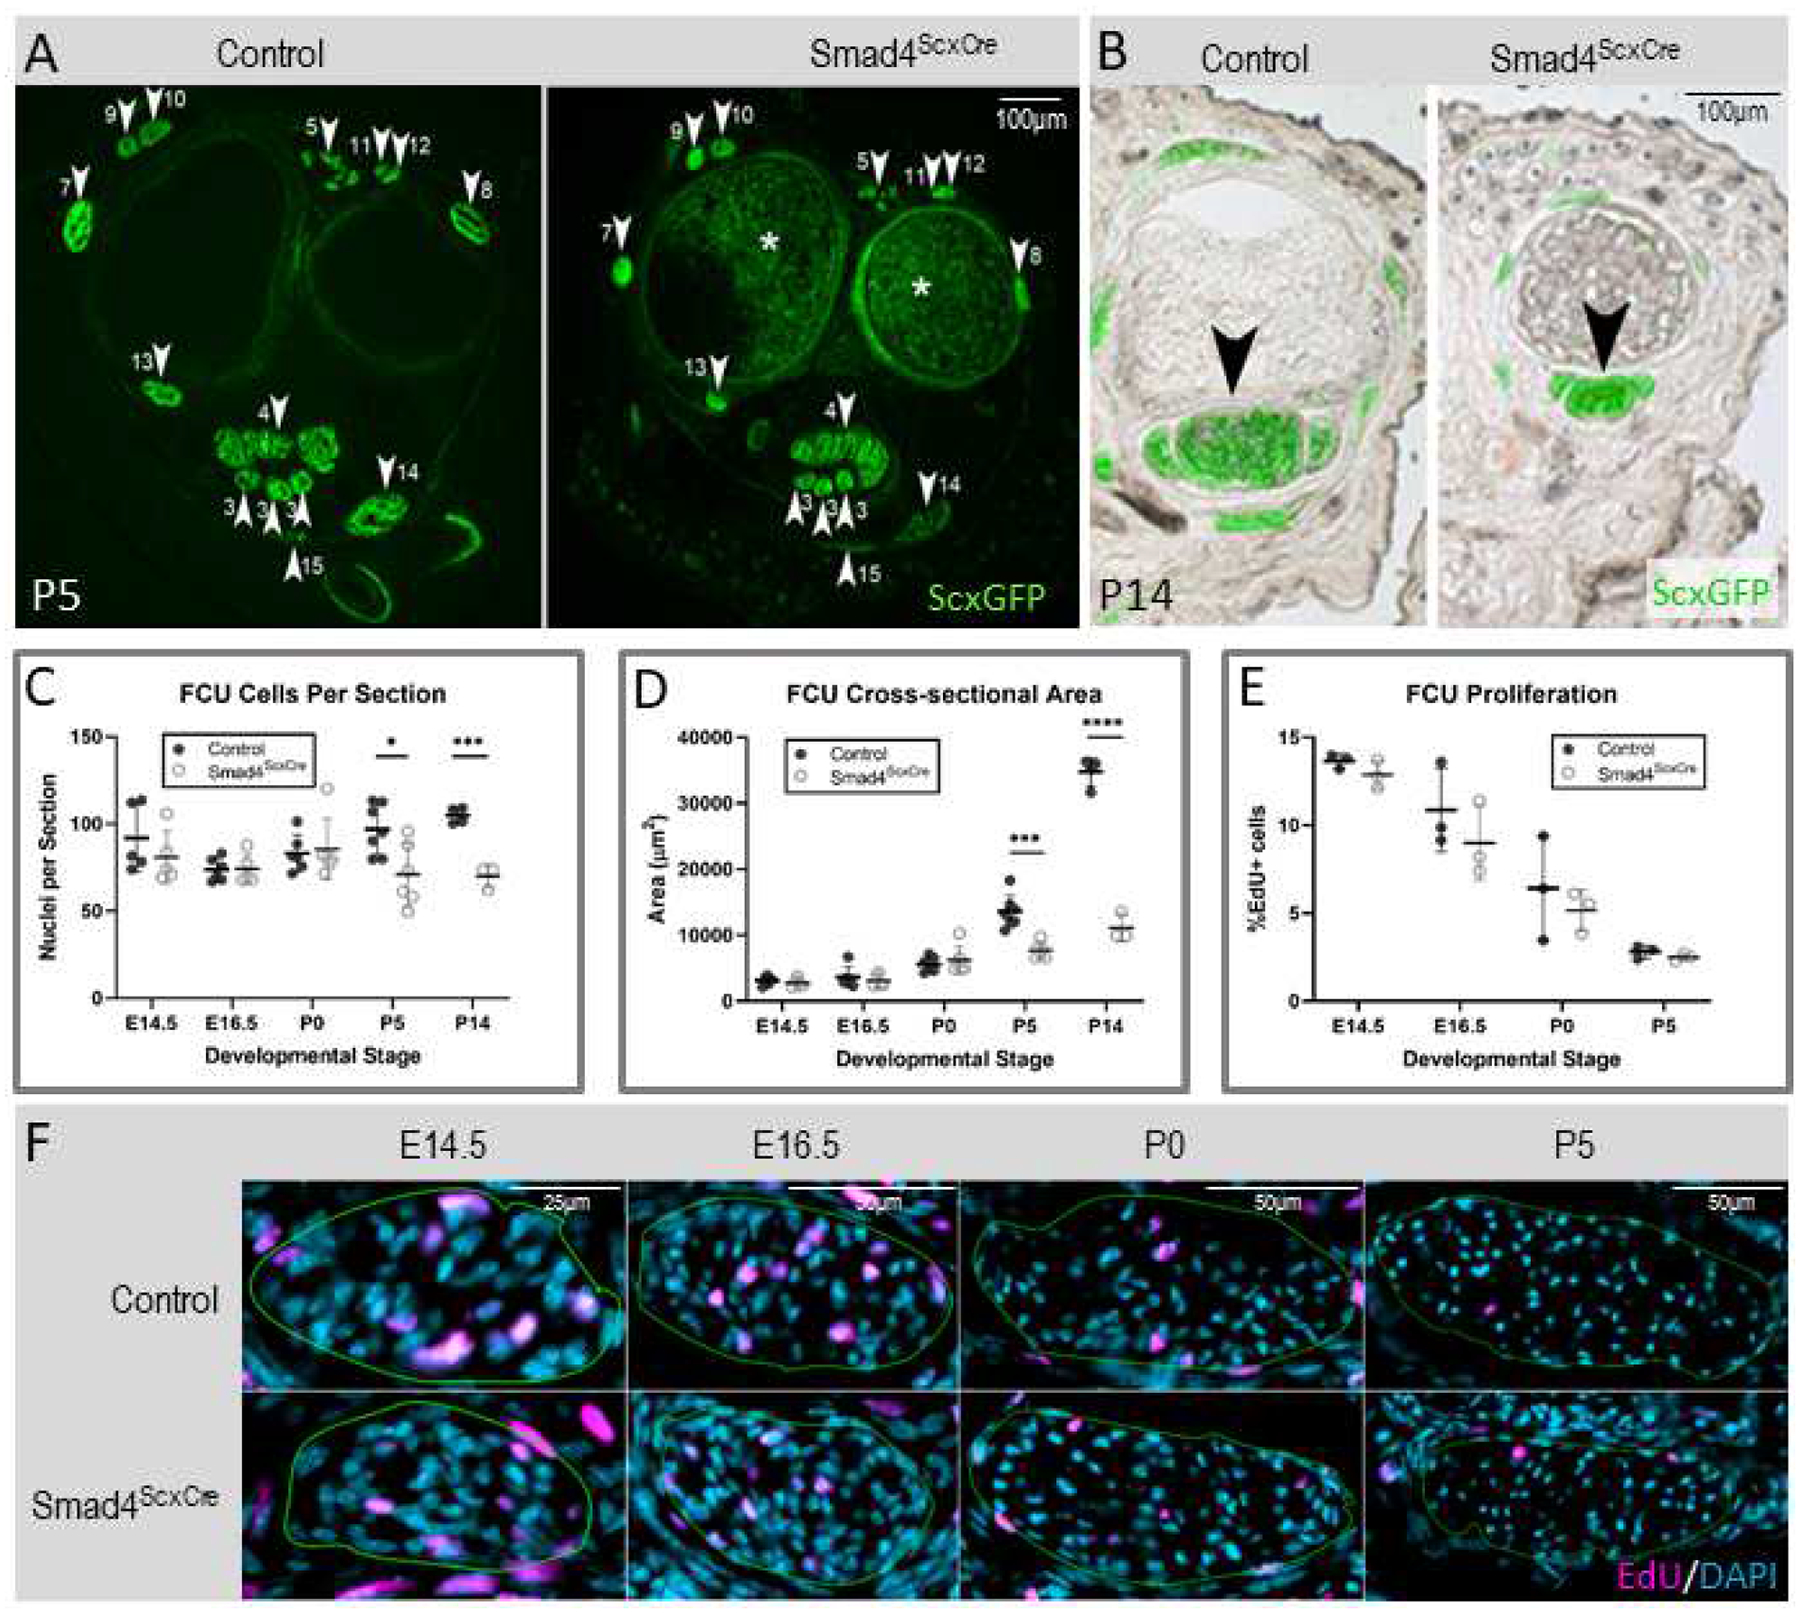
Figure 2: Smad4ScxCre mutant tendons are smaller with fewer cells and smaller collagen fibrils.

(A) Cross section at wrist levels of forelimbs from P5 control and Smad4ScxCre mutant pups. White arrowheads and associated numbers label tendons as previously published (Watson et al., 2009). * is background signal from bone marrow and is not ScxGFP signal. (B) Cross sections of forelimb digits from P14 control and Smad4ScxCre mutant. Brightfield images were overlaid with ScxGFP signal to label the tendons. Mutant tendons are significantly smaller than controls (black arrowheads). (C,D,E) Quantification of Flexor Carpi Ulnaris (FCU) cells per section (C), cross-sectional area (D), and percentage of EdU+ cells (E) analyzed in cross sections from control and Smad4ScxCre forelimbs at E14.5, E16.5, P0, P5, and P14. Bars represent standard deviation. *p<0.05 **p<0.01 ***p<0.001 ****p<0.0001 (F) Representative images of EdU-stained sections at E14.5, E16.5, P0, and P5. Green outline represents the tendon boundary.
