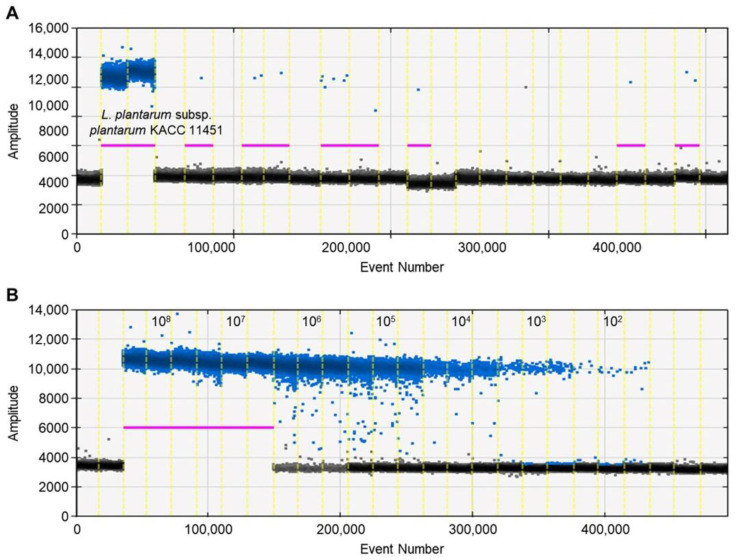
Figure 2.
Assessment of primer specificity and sensitivity using ddPCR. The positive and negative droplets classified as the thresholds of individual wells are indicated in blue and black, respectively. The threshold is determined by the droplet reader and is shown as a horizontal line. (A) Specificity of primer by ddPCR; (B) quantification of genomic DNA of L. plantarum subsp. plantarum KACC 11451 by ddPCR.

