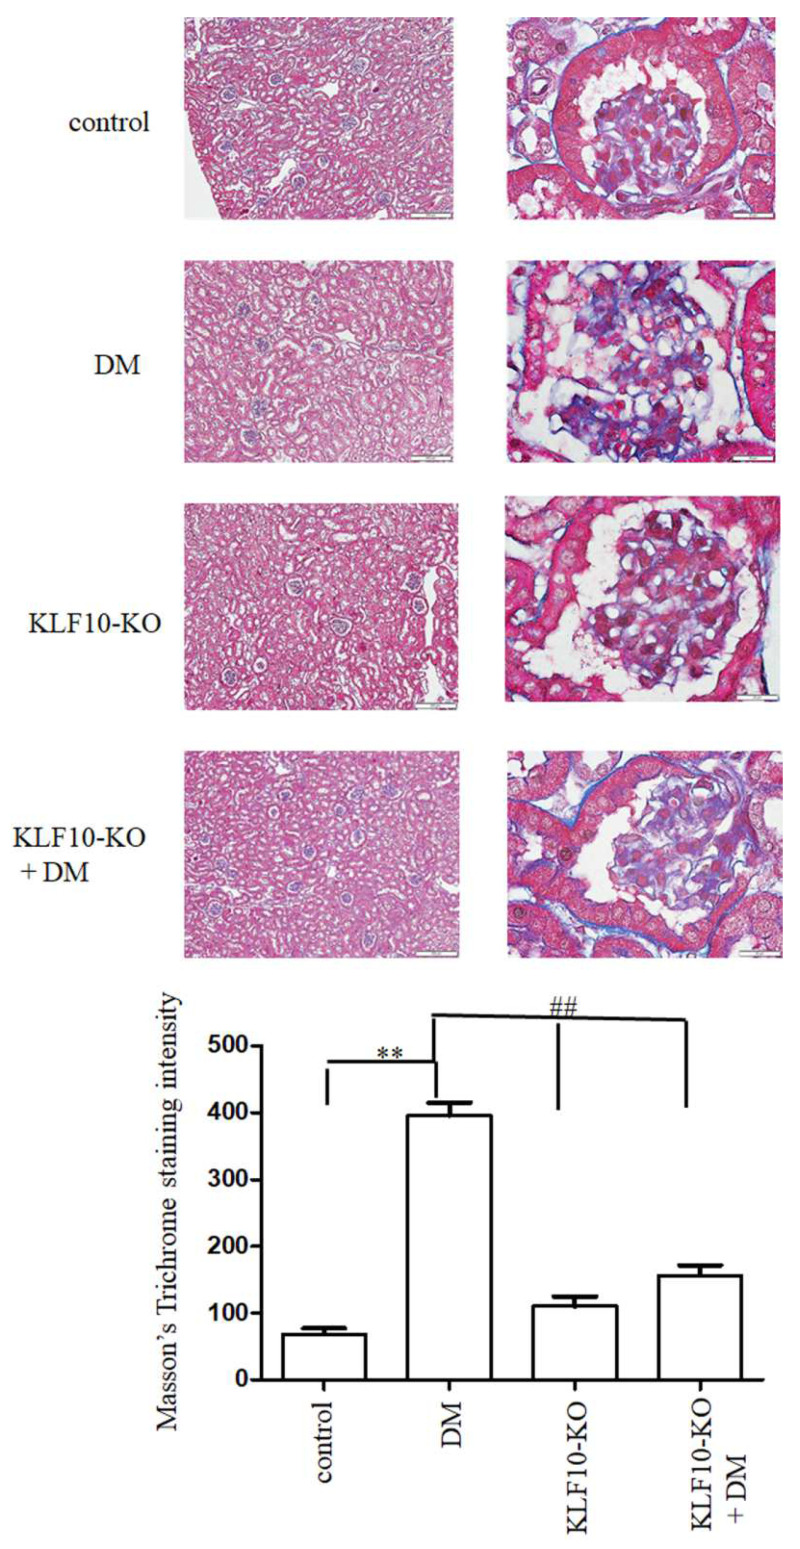
Figure 5.
Knockout of KLF10 ameliorated diabetic renal fibrosis. Masson’s Trichrome staining was conducted to determine the renal fibrosis level (upper panels; left: magnification of 100×, right: magnification of 1000×). Lower panel: data are presented as means ± standard deviation from three different mice **: p < 0.01 compared with the control group. ##: p < 0.01 compared with the DM group. Scale bar: 200 μM at 100× and 20 μM at 1000×.

