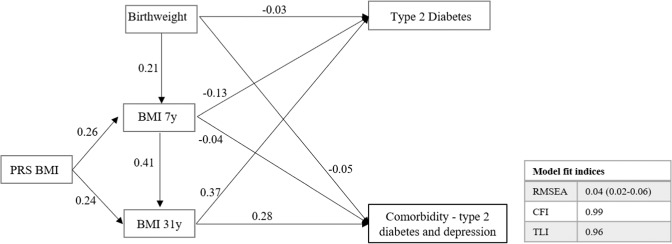
Fig. 1. Path diagram illustrating the relationship between adiposity measures over the lifecourse with two outcomes.
The values in the path diagram are regression coefficients showing a significant direct effect (P ≤ 0.0001) between the variables. Estimates should be interpreted as one standard deviation increase in birthweight is associated with an increase of 0.21 units in BMI at 7 years. No statistically significant pathways were observed with depression. The estimates for the total, direct and indirect standardized effects of the pathways are presented in Supplementary Table S6. BMI body mass index, CFI comparative fit index, PRS polygenic risk score, RMSEA root square error of approximation, TLI Tucker–Lewis index.

