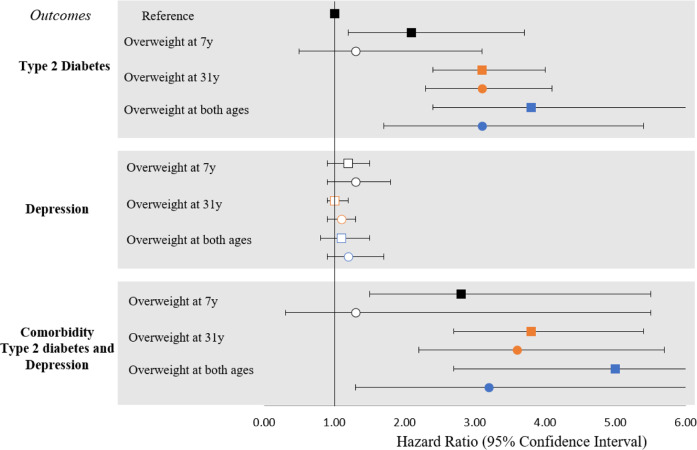
Fig. 2. Hazard risk ratio of patterns of overweight over the lifecourse with the three outcomes: type 2 diabetes, depression, and comorbidity.
Boxes represent model 1: unadjusted; and circles represent model 2: adjusted for sex, low education, smoking, low physical activity, and unhealthy diet score at 31 years. In the calculation of hazard ratio, participants who had never been overweight were used as reference group. White box and circle denote P ≥ 0.05 and coloured box and circle denotes P ≤ 0.05. Estimates to be interpreted as the risk of outcome with unit change in the exposure.

