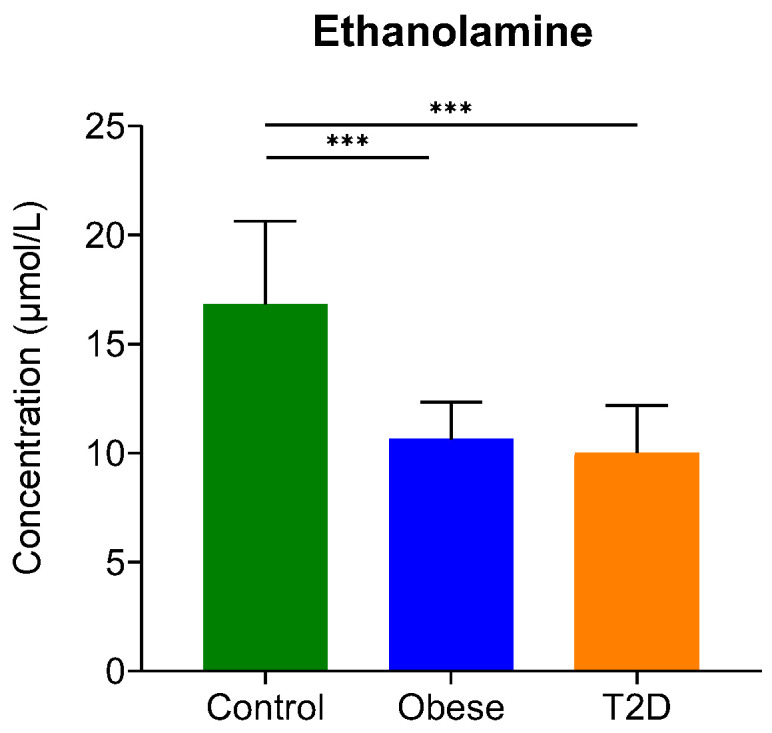
Figure 2.

The serum concentration of ethanolamine. The y-axis represents the concentration in µmol/L of biogenic amine on the x-axis. ***, p-value ≤ 0.001. The green color refers to the control group, the blue color represents the obese group, and the orange indicates the T2D group.
