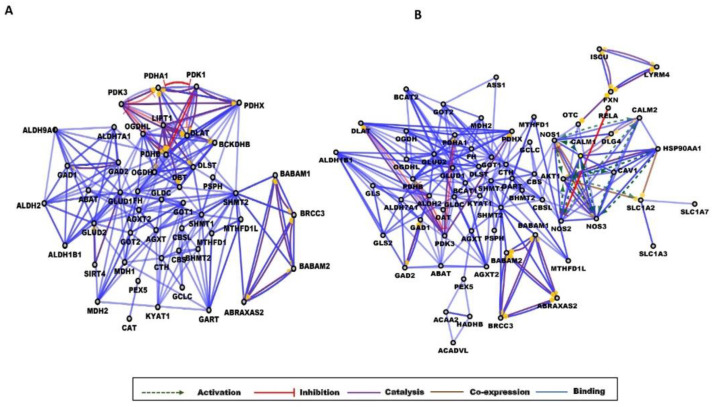
Figure 3.
Gene interaction networks in obesity and diabetes. Partial network view for (A) obese and (B) T2D networks. The circles represent a gene/protein and the lines indicate interactions. The lines with an arrow represent activation, blocking lines represent inhibition, and simple lines represent protein–protein interaction. Line color indicates the type of interaction: green color refers to activation, red color to inhibition, blue color to binding, brown color to co-expression, and purple color to catalysis. On all panels, the proteins are labeled with their gene name. The full network images of these networks are presented in Figure S2.

