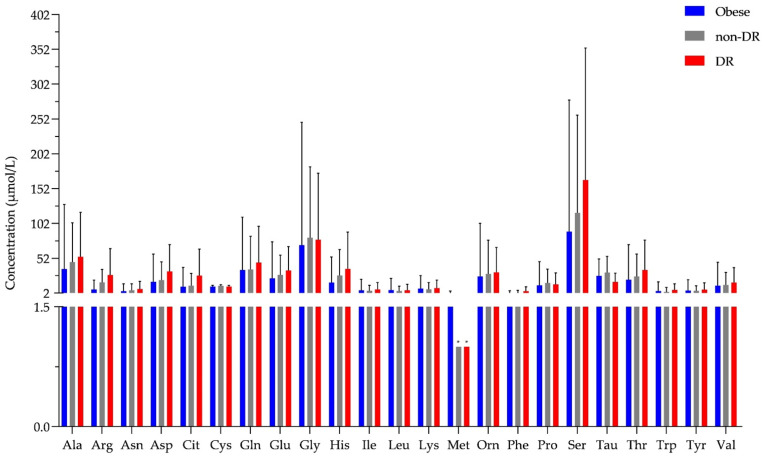
Figure 4.
The concentration of amino acids in tear. The y-axis shows the concentration in μmol/L of all 23 amino acids shown on the x-axis. * shows amino acids that were detected but could not be quantified and an arbitrary value of 1 was assigned. Blue bars represent the obese group, the gray bar indicates the T2D group without diabetic retinopathy (non-DR), while the red bars represent the T2D group with diabetic retinopathy (DR).

