Figure 5.
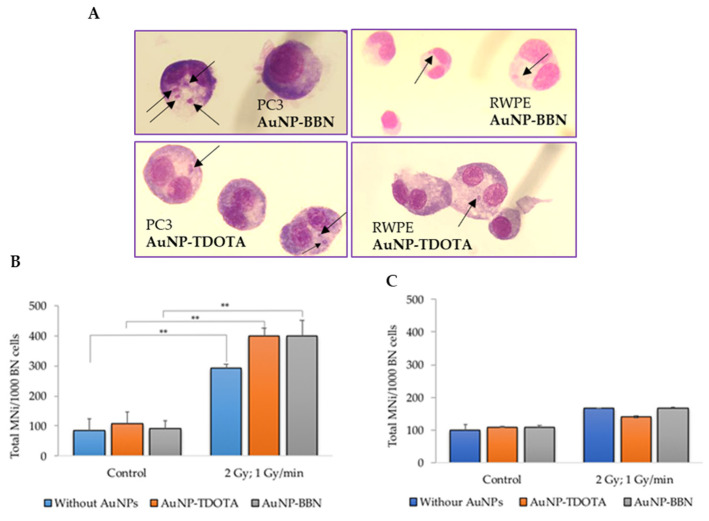
Genotoxic effects, in PC3 and RWPE-1 cells, after incubation with AuNP-TDOTA and AuNP-BBN at a concentration of 36 µg Au/mL followed by 2 Gy of γ-radiation (dose rate of 1 Gy/min), evaluated by the CBMN assay. (A) Representative light microscopy images of DNA damage in the tumoral cells PC3 and non-tumoral cells RWPE-1, respectively. The arrows indicate the presence of MNi. Giemsa staining was used to visualize the nuclei and cytoplasm under 40× magnification. (B,C) Average number of MNi per 1000 BN cells in PC3 cells and RWPE-1 cells, respectively. Statistical significance was calculated using two-tailed Student’s t-test with irradiation-only cells as the control (** p ≤ 0.001) The results were calculated from independent biological replicates (n = 2) and are given as the mean ± S.E.M.

