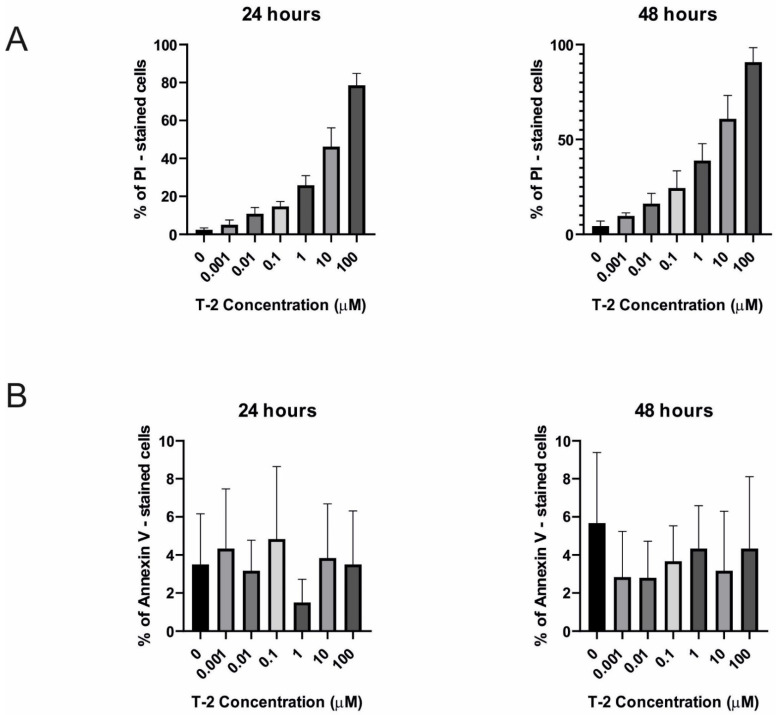
Figure 4.
The T-2 effect on necrosis and apoptosis induction in Hs68 cells. The cell death pathway was assayed by flow cytometry with annexin V/propidium iodide staining after 24 h (A) and 48 h (B) of incubation with the toxin. Values: means ± SD (n = 6). 0: untreated (control) cells; 0.001: concentration of toxin—0.001 µM; 0.01: concentration of toxin—0.01 µM; 0.1: concentration of toxin—0.1 µM; 1: concentration of toxin—1 µM; 10: concentration of toxin—10 µM; 100: concentration of toxin—100 µM.

