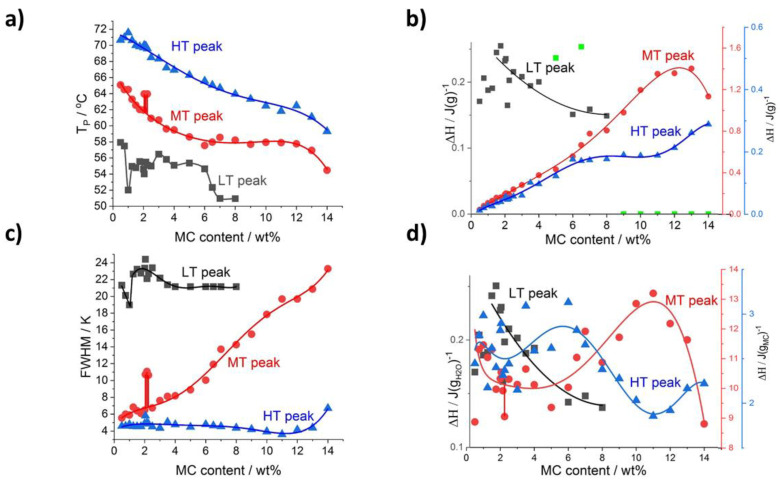
Figure 4.
Deconvolution results for heating scans as a function of MC content: (a) peaks’ temperature position and (b) peak’s transition heat normalized to sample mass (c) peaks’ width FWHM, (d) peak’s heat normalized to H2O (LT peak) and MC content (MT and HT peaks). Green points in (b) are LT peak area values excluded from the trend analysis due to high deviation.

