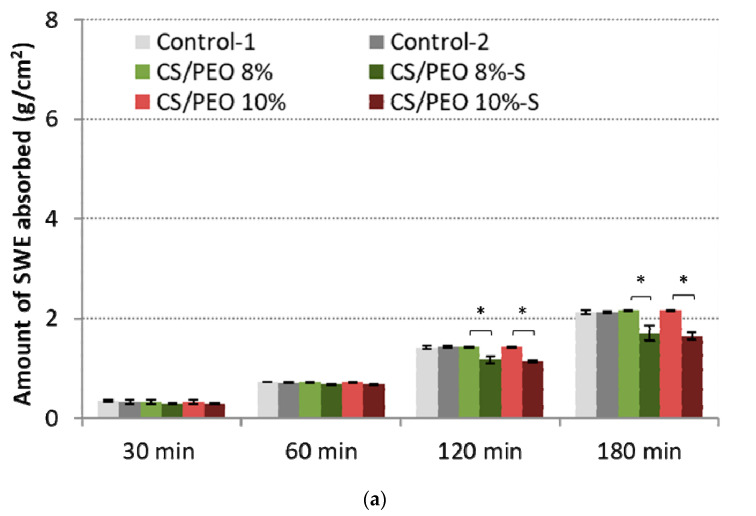
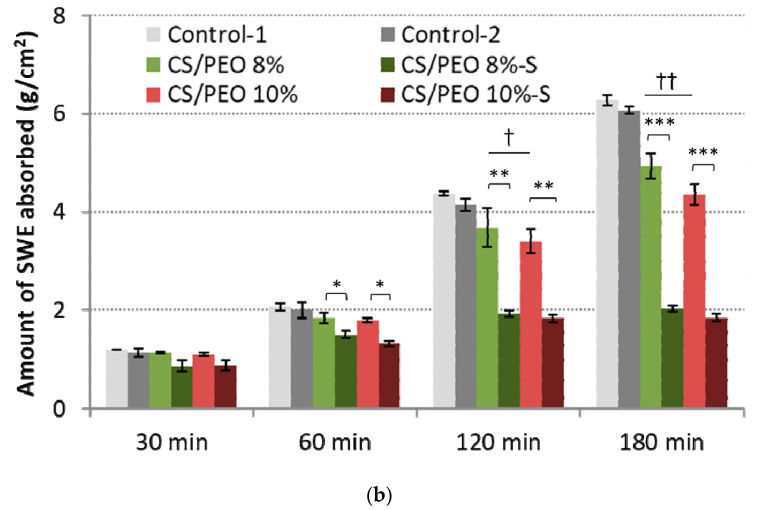
Figure 5.
Total simulated wound exudate fluid absorption response of CS/PEO nanofibers and commercial wound dressings (Control-1; Control-2) at: (a) low (0.6 mL/h), and (b) high fluid flow rate (2.0 mL/h) (mean ± S.D.; n = 3); * represents significant differences with p ≤ 0.05, ** represents significant differences with p ≤ 0.01, while *** represents significant differences with p ≤ 0.001 between uncoated and S-coated nanofibers; † and †† symbolize significant differences with p ≤ 0.05 and p ≤ 0.01 between uncoated nanofibers and Controls, respectively.


