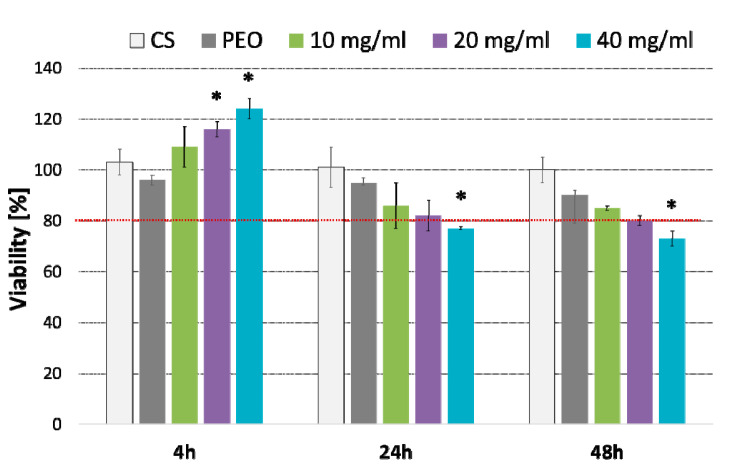
Figure 7.
Column charts displaying viability of fibroblasts cells (as compared to untreated cells) incubated with different concentrations (expressed in mg/mL) of CS/PEO 10% nanofibers for 4, 24 or 48 h measured by MTT assay (mean ± SD; n = 3); cells treated with pure CS and pure PEO at concentrations corresponding to those in extract sample CS/PEO 10% at 40 mg/mL were used as controls. * represents significant differences with p ≤ 0.05 in comparison to untreated cells.

