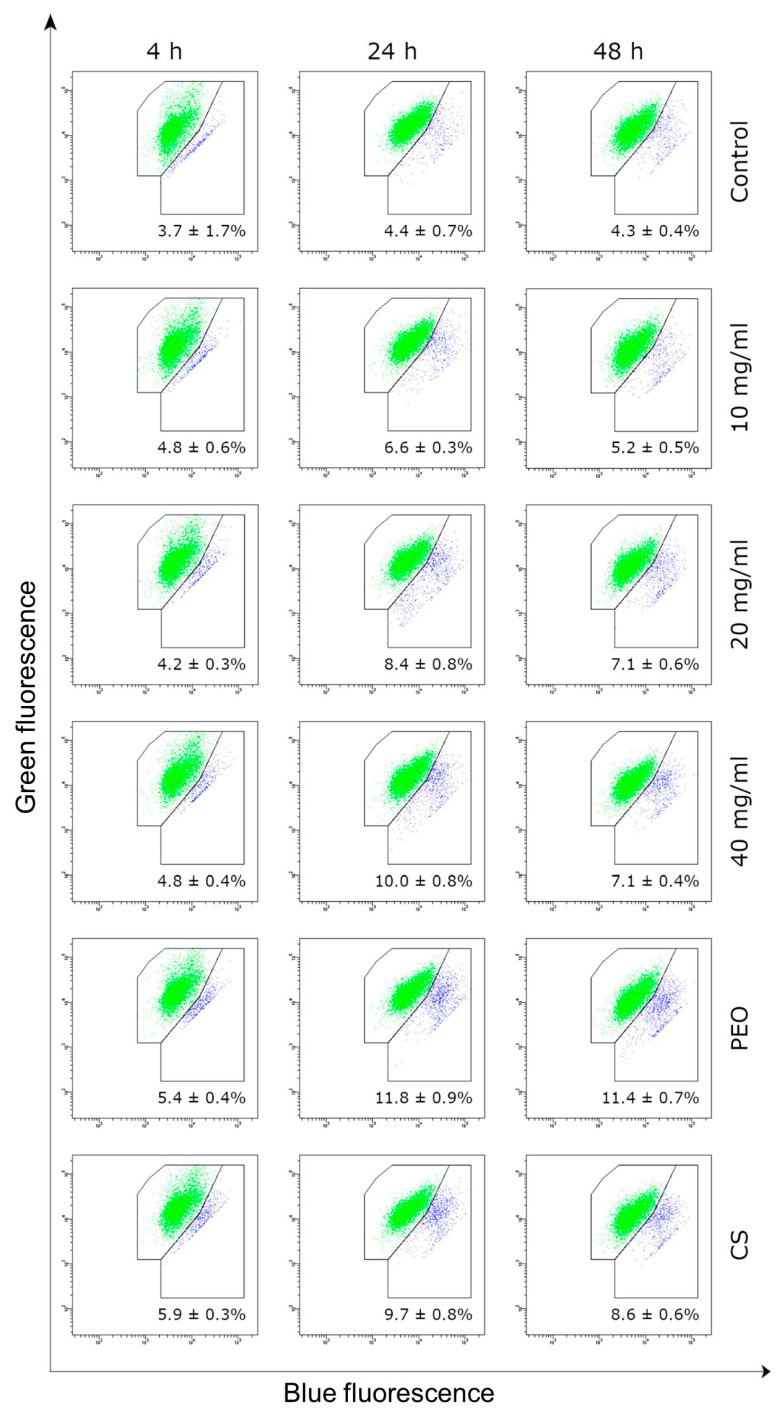
Figure 8.
Representative dot-plots displaying the mitochondrial membrane potential of HDFa fibroblast cells incubated for 4, 24 or 48 h with CS/PEO 10% extract in concentration range 10–40 mg/mL measured by JC-1 fluorescence (green-cells with normal MMP, blue-with decreased MMP); data embedded in each dot-plot (as mean for three independent measurements) represents the percent of cells with decreased MMP; untreated cells (K0), cells treated with pure CS and pure PEO at concentrations corresponding to those in sample CS/PEO 10% at 40 mg/mL were used as controls.

