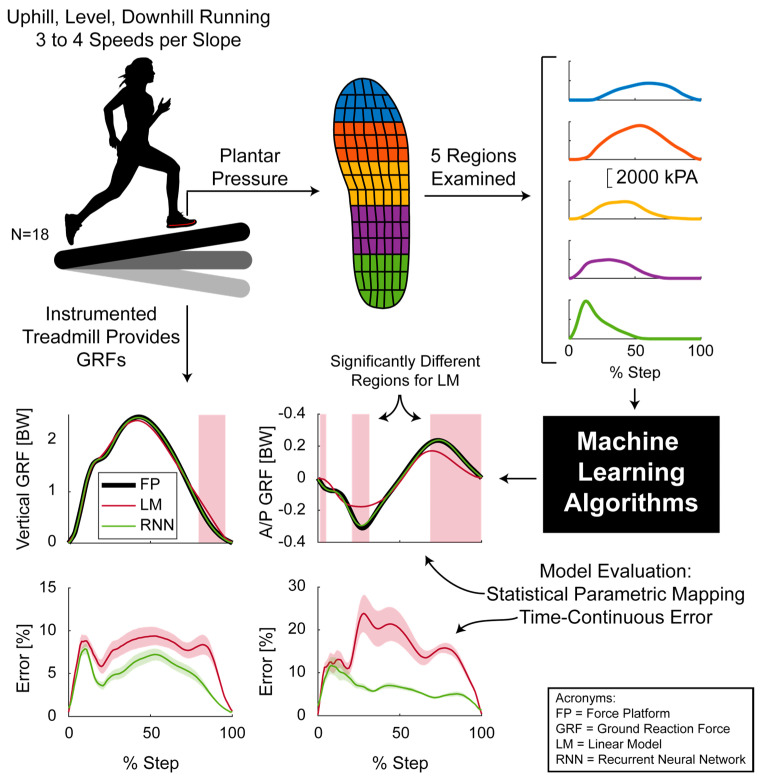
Figure 2.
Vertical and anterior−posterior (A/P) ground reaction force prediction using plantar pressure. The plantar pressure was segmented into five different regions (indicated by the different colors). Example plantar pressure curves are shown in the same color to the right of the respective region. Additional inputs to the machine learning algorithms include running speed, running slope, and subject mass. Model performance was then evaluated using statistical parametric mapping, time continuous error (study mean ± standard deviation), root mean square error (not shown here), and correlation coefficients (not shown here).

