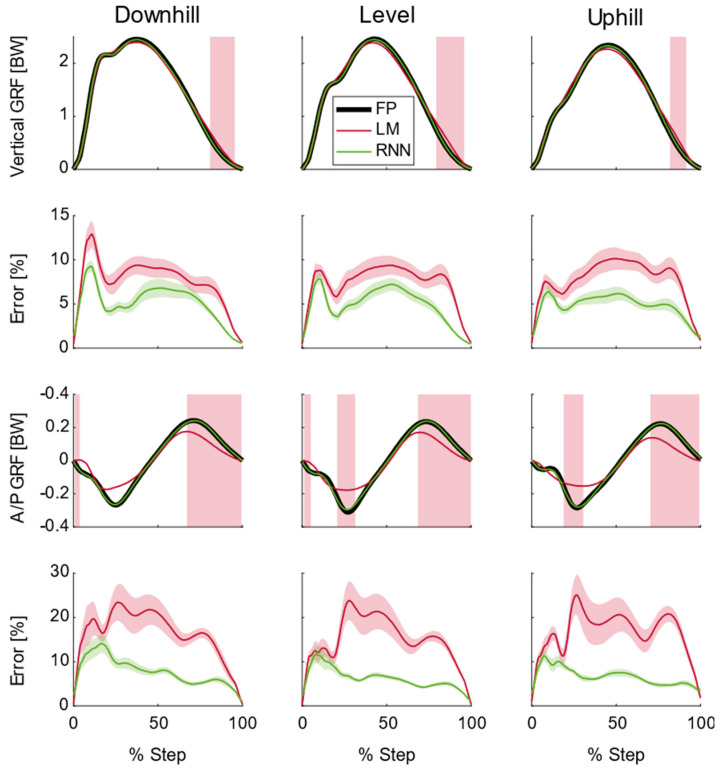
Figure 5.
Average (N = 18) ground reaction forces (GRFs), model predictions, and model errors for running at 3.0 m/s. Top row shows average vertical GRF from the force platform (FP) along with average linear model (LM) and recurrent neural network (RNN) predictions. Areas shaded red are where there were significant differences between the FP and LM (p < 0.05). There were no significant differences between the FP and the RNN (p > 0.05). The second row shows the mean absolute percent error plus/minus one standard deviation for each model in the vertical direction. The third row shows average anterior/posterior (A/P) GRF from the FP along with LM and RNN predictions. Areas shaded red are where there were significant differences between the FP and LM (p < 0.05). There were no significant differences between the FP and the RNN (p > 0.05). The last row shows the mean absolute percent error plus/minus one standard deviation for each model in the A/P direction. Downhill and uphill running was performed at 6° (10.5% grade).

