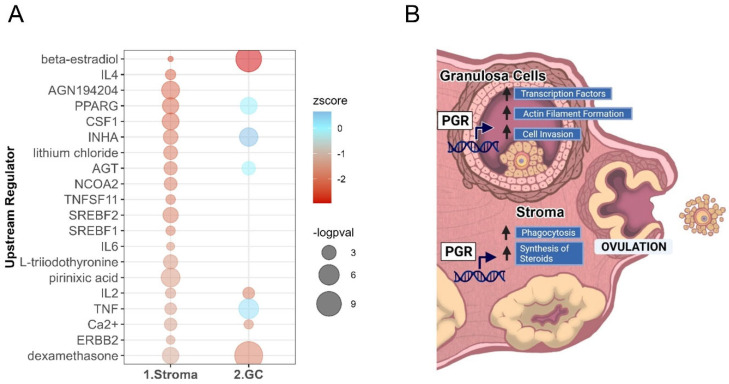
Figure 9.
Pathways analysis comparing cell-specific DEGs shows unique regulation by PGR in stroma. (A) Top 20 deactivated upstream regulators predicted for stromal DEGs, ordered and colored by z-score indicating inactivation, sized by log p-val. The upstream regulators are also identified in the granulosa cell RNA-seq analysis shown on right. (B) Summary of the effect of PGR on intraovarian functional pathways at ovulation.

