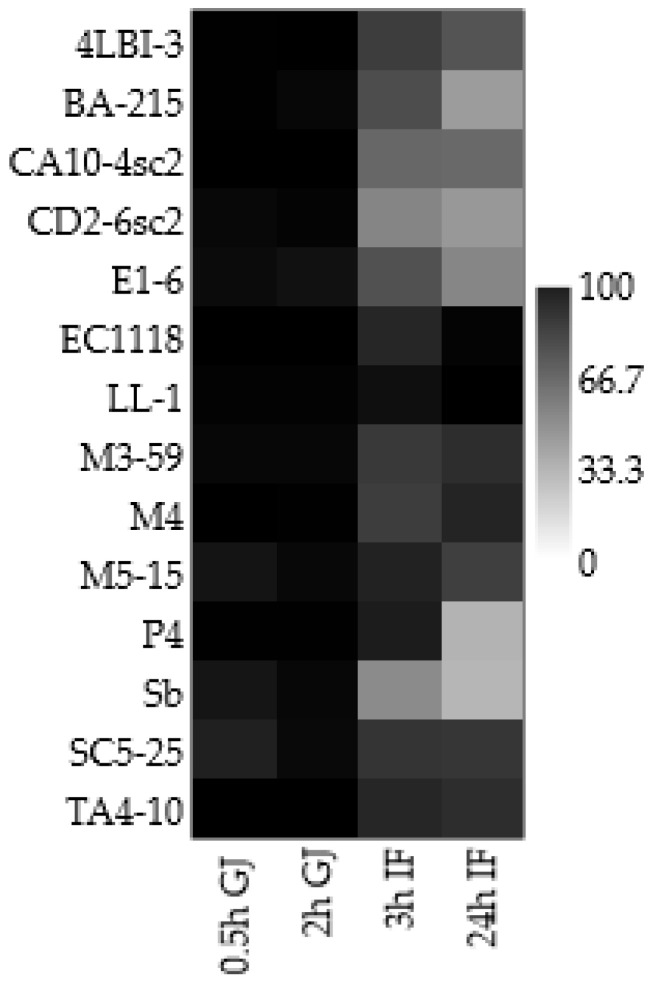
Figure 4.
Matrix plot based on the evaluation of simulation of the transit into gut of the 14 Saccharomyces cerevisiae strains. The results are reported as Viability Index and expressed with a colour scale, where black indicate the highest Viability Index (VI) and light grey the lowest value. Data were reported as means of two independent experiments. 0.5 h and 2 h GJ = strain VI in Gastric Juice (GJ) after 0.5 h and 2 h of incubation, respectively; 3 h IF and 24 h IF = strain VI in intestinal fluid (IF)) after 3 h and 24 h of incubation, respectively.

