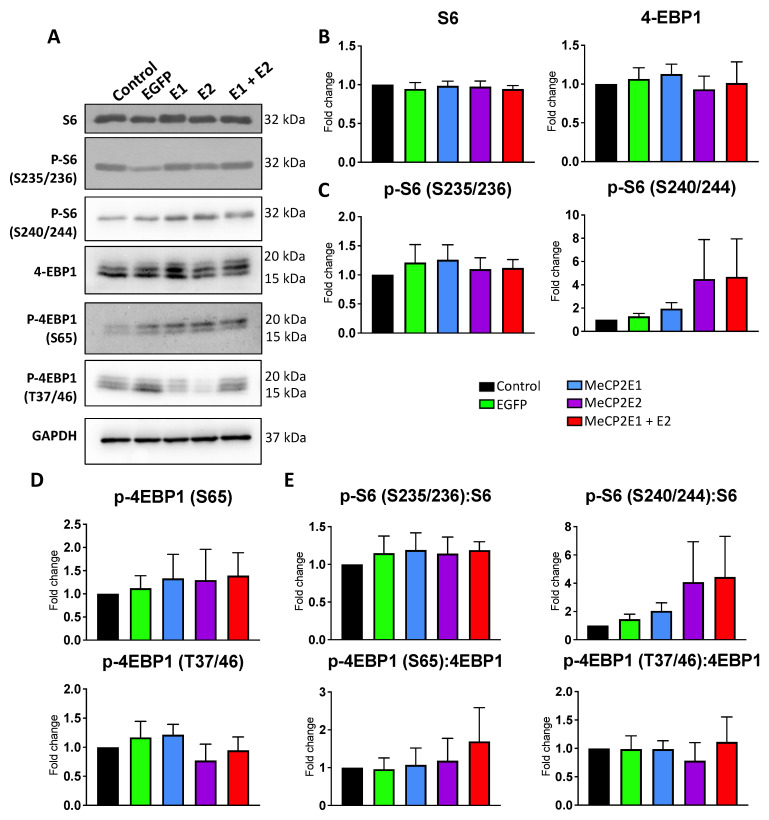
Figure 10.
Protein analysis of ribosomal protein S6 and components of protein translation initiation in Daoy cells transduced with lentiviral vectors overexpressing MeCP2 isoforms. (A) Western blot analysis of the indicated proteins in non-transduced control Daoy cells, EGFP-transduced (EGFP), E1-transduced (E1), E2-transduced (E2), and E1 + E2-tranduced (E1 + E2) cells. (B,C) Quantification of the indicated total proteins from A. (D,E) Ratio analysis of phosphorylated proteins from A versus their non-phosphorylated pan proteins. n = 4–6 (n = 4 for p-4EBP1 (S65), p-S6 (235/236); n = 5 for p-4EBP1 (T37/46), n = 6 for S6, p-S6 (240/244), n = 6 for 4EBP1), and data are reported as mean ± SEM. For ratio of phosphorylated proteins to their pan protein abundances (Part D), samples from the same biological replicate were analyzed against the pan proteins from the same set. For the reported ratios, where n is different for the phosphorylated proteins versus their pan protein, n for the ratio would be equal to the lowest n within the phospho-pan protein pair.

