Figure 3.
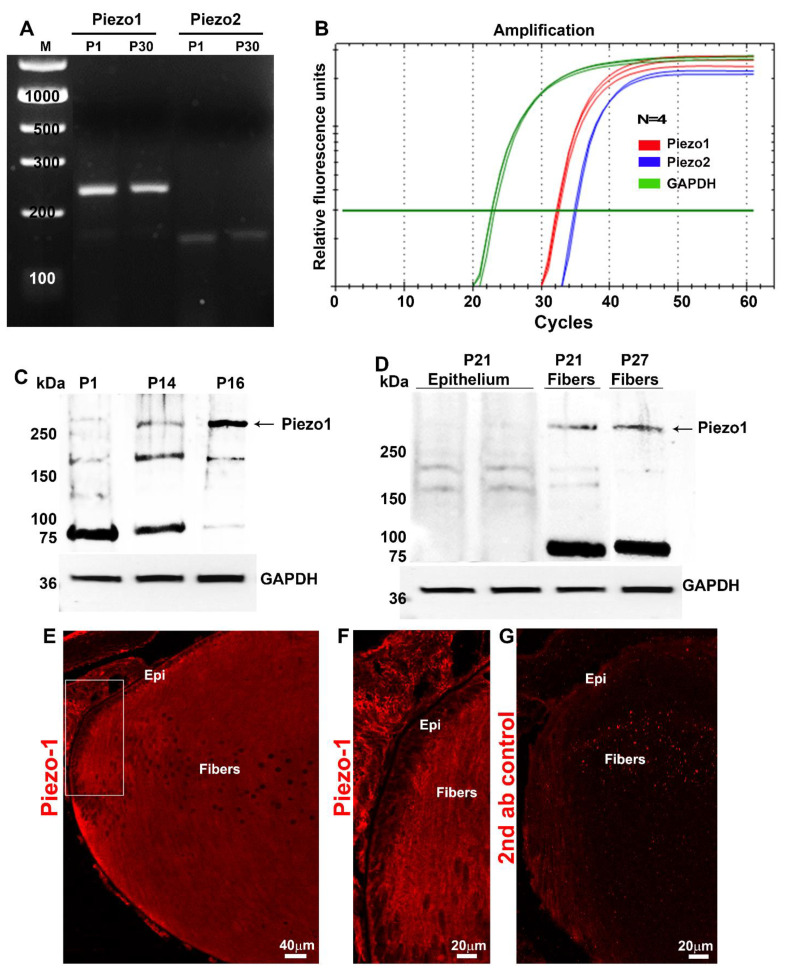
Expression and distribution of Piezo channels in mouse lenses. (A). RT-PCR-based confirmation of Piezo1 and Piezo2 expression in P1 and P30 mouse lenses. (B). qRT-PCR analysis revealed a relatively much higher level of Piezo1 expression in the lens (P30) compared to Piezo2. (C). Total lysates (800× g supernatants; 75 µg protein) derived from the P1, P14, and P16 mouse lenses analyzed using a Piezo1 polyclonal antibody exhibited immunopositive bands with an expected molecular mass of >250 kDa and >150 kDa. There was also a prominent immunopositive band at >75 kDa in the P1 and P14 lenses, the levels of which appeared to be decreased in the P16 lenses. (D). Piezo1 immunopositive bands of >250 and >75 kDa were present predominantly in the lens fiber samples (P21 and P27) compared to the lens epithelium (P21). (E,F). Immunofluorescence analysis of Piezo1 in the P1 mouse lens (the sagittal plane of the cryosection) revealed that the protein distributes predominantly to lens fibers relative to the epithelium (boxed area in panel (E) was magnified and shown in panel (F)). (G) Shows background immunofluorescence with secondary antibody alone. GAPDH: Loading control; Epi: Epithelium; Bars: Image magnification.

