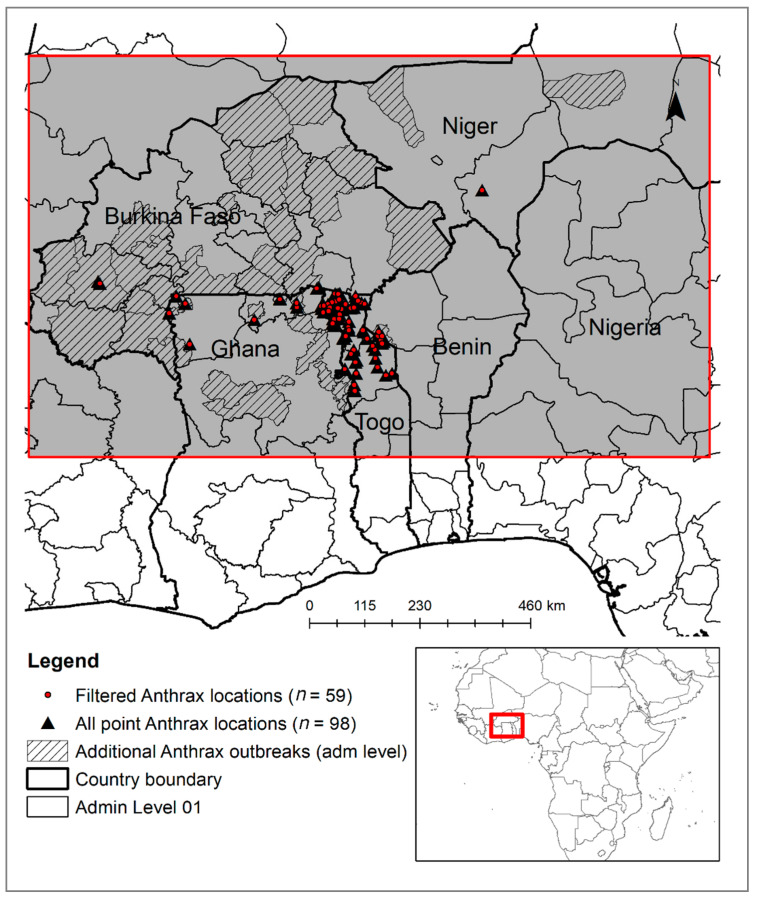
Figure 1.
Study area and anthrax outbreak locations before (black triangle) and after (red dots) filtering spatial auto-correlated records (point location data source: EMPRES-i, GIMD and FAO workshop). The dashed polygons are anthrax-affected districts (adm02 level) for which geo-locations of outbreaks are missing (polygon data source: OIE-WHAIS).

