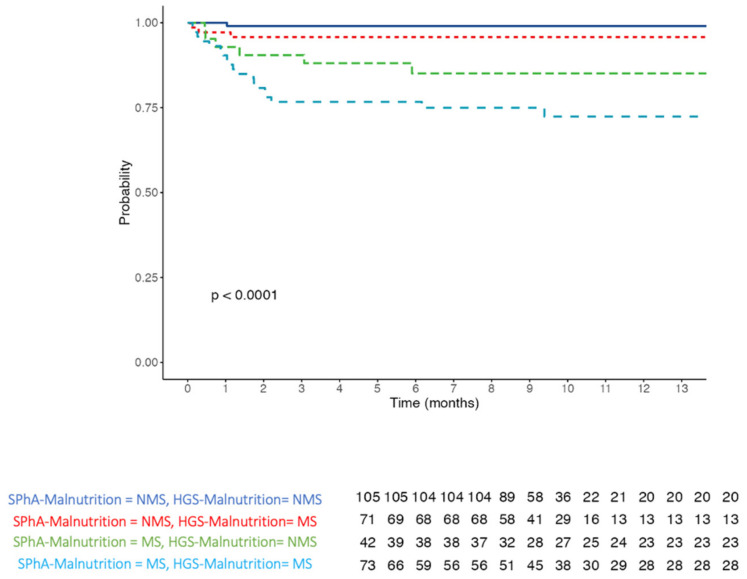
Figure 4.
Kaplan–Meier survival curves of patients in groups with low or high SPhA-Malnutrition and HGS-Malnutrition. The table at the bottom indicates the number of surviving patients in each group corresponding to the intervals in the graph. Abbreviations: malnutrition status (MS)—non-malnutrition status (NMS).

