Figure 4.
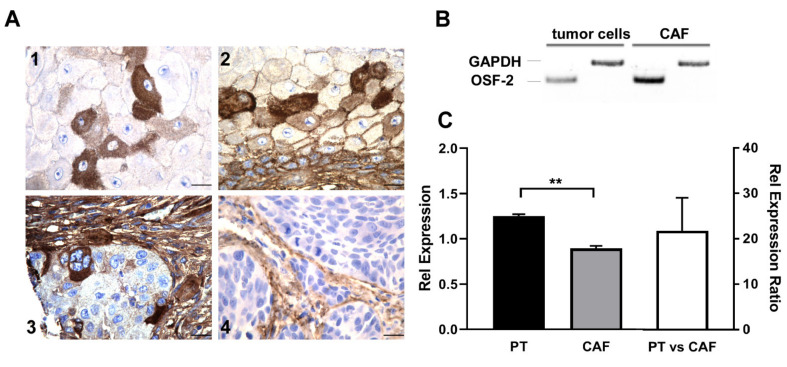
OSF-2 is expressed in the tumor microenvironment. (A) Immunohistochemical analysis of OSF-2 expression in primary HNC tissue. Intense staining was observed in cancer cells (1,2), but also in the juxtatumoral stroma (3,4). Scale bars, 20 µm. (B) RT-PCR of primary tumor cells and CAFs revealed higher expression of OSF-2 in CAFs. GAPDH was used as a control. (C) Up-regulation of OSF-2 in CAFs compared to primary tumor cells was confirmed by quantitative real-time-PCR. Up-regulation is shown by lower CT values and thus, a lower relative expression for CAFs. OSF-2 expression in primary tumor cells (PT, black) and CAFs (grey) is shown compared to RNA-Pol II expression (OSF-2/RNA-Pol II; left axis), and as relative expression ratio R (right axis). R = 21.18, n = 2, ** p < 0.005. The uncropped western blot figures were presented in Figure S10.

