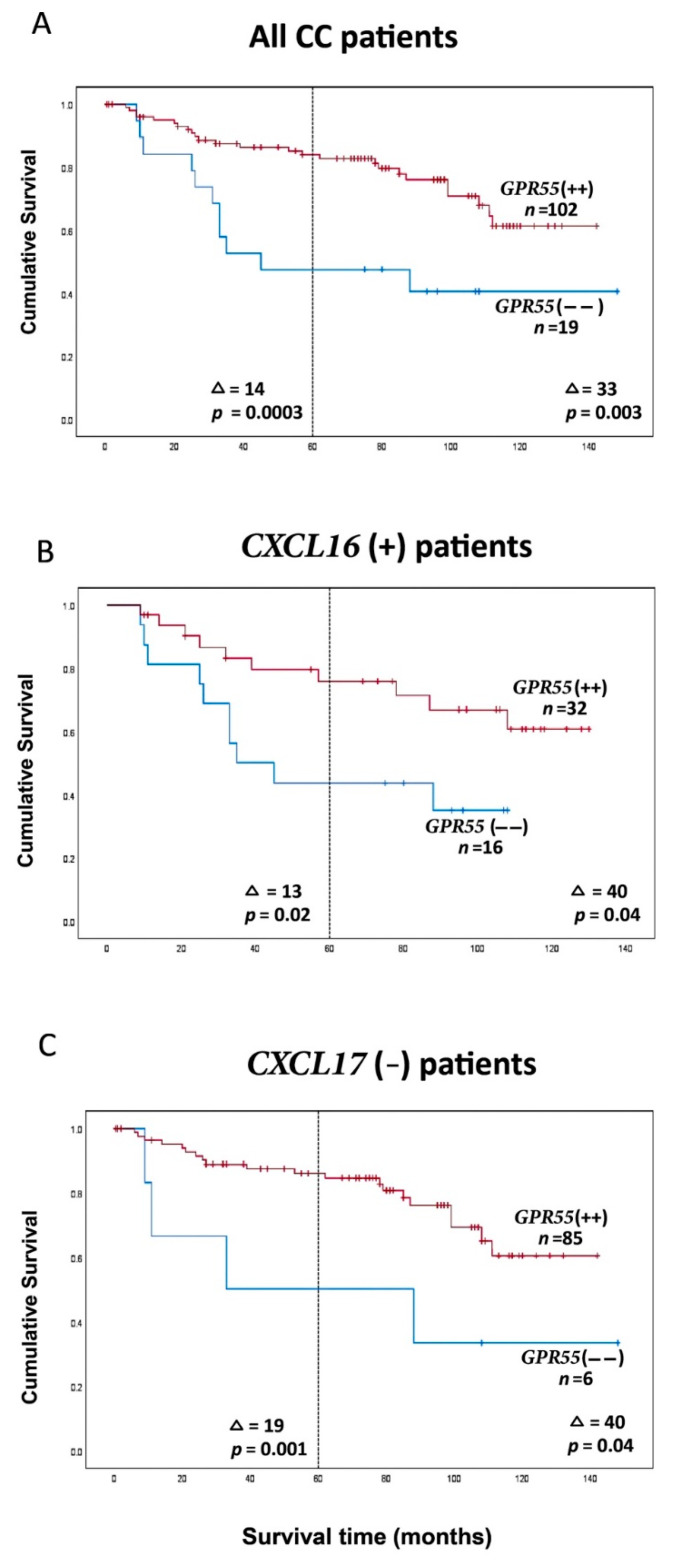
Figure 4.
(A) Kaplan–Meier cumulative survival curves for GPR55(−−) and GPR55(++) patients. All 121 CC patients are included. Each patient is represented by the lymph node with the lowest GPR55 mRNA value. A GPR55 mRNA/CEA mRNA ratio of 0.1481 was used to divide the patients into two groups. (B) Kaplan–Meier cumulative survival curves for GPR55(−−) and GPR55(++) patients. The analysis is restricted to patients with CXCL16 mRNA levels in the highest lymph node > 7.2 mRNA copies/18S rRNA unit. The number of patients was 48. A GPR55 mRNA/CEA mRNA ratio of 0.1481 was used to divide the patients into two groups. (C) Kaplan–Meier cumulative survival curves for GPR55(−−) and GPR55(++) patients. The analysis is restricted to the CXCL17 mRNA levels in the highest lymph node < 0.0014 mRNA copies/18S rRNA unit. The number of patients was 91. A GPR55 mRNA/CEA mRNA ratio of 0.1481 was used to divide the patients into two groups. The patients were followed for 12 years. Differences in disease-free survival time after surgery between the two groups are given as a ∆-value in months and statistical significance as p-values; n = number of patients in the respective group.

