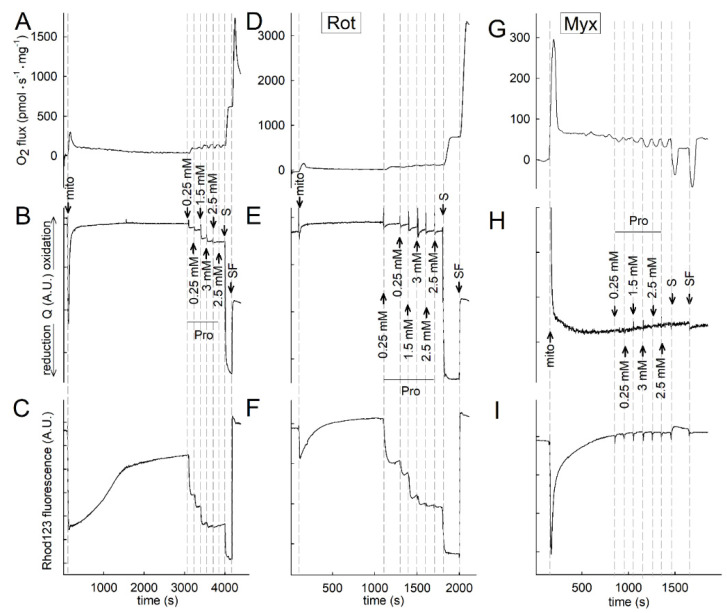
Figure 3.
Coenzyme Q (Q) redox state recorded simultaneously with oxygen consumption rate and rhodamine 123 fluorescence in isolated mouse liver mitochondria using the NextGen-O2k. (A) Oxygen consumption. (B) Q redox state. (C) Rhodamine 123 fluorescence indicative of ΔΨmt (arbitrary units A.U.). No substrates were present. Succinate (S, 5 mM) and proline (Pro) were added at the concentrations indicated. 0.25 µM SF (D–F) as in A, B, and C, but rotenone was present in the medium. (G–I) As in A, B, and C, but 0.1 µM myxothiazol was present in the medium.

