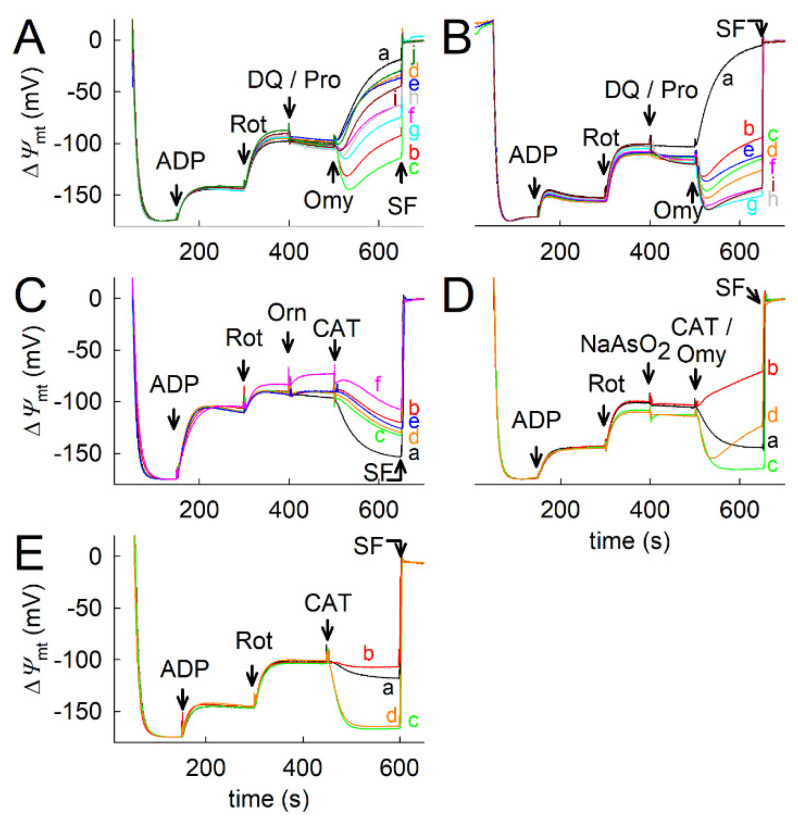
Figure 10.
Fuelling of CIII with duroquinone (DQ), but not ornithine, partially mimics the effects of proline; neither arsenite nor dicoumarol antagonize proline. Traces are time courses of safranine O signal calibrated to ΔΨmt. 0.25 µM SF. (A) Liver mitochondria; GM always present and the following additions; black (a): no other additions; red (b): 2 mM Pro; green (c): 5 mM Pro; orange (d): 0.01 mM duroquinone (DQ); blue (e): 0.05 mM DQ; magenta (f): 0.1 mM DQ; cyan (g): 0.2 mM DQ; grey (h): 0.3 mM DQ; brown (i): 0.4 mM DQ; dark green (j): 0.5 mM DQ. (B) kidney mitochondria; GM always present and the following additions; black (a): no other additions; red (b): 2 mM Pro; green (c): 5 mM Pro; orange (d): 10 mM Pro; blue (e): 0.01 mM DQ; magenta (f): 0.05 mM DQ; cyan (g): 0.1 mM DQ; grey (h): 0.2 mM DQ; brown (i): 0.3 mM DQ. (C) Liver mitochondria; 5 mM oxoglutarate (Og) always present and the following additions; black (a): no other additions; red (b): 2 mM ornithine (Orn); green (c): 5 mM Orn; orange (d): 10 mM Orn; blue (e): 20 mM Orn; magenta (f): 40 mM Orn. (D) Liver mitochondria; GM always present and the following additions; black (a): no other additions; red (b): 2 mM NaAsO2; green (c): 5 mM Pro and 2 mM NaAsO2; orange (d): 5 mM Pro and 2 mM NaASO2. (E) Liver mitochondria. GM & 5 mM βOH always present and the following additions; black (a): no other additions; red (b): 0.5 µM dicoumarol; green (c): 5 mM proline; orange (d): 5 mM proline & 0.5 µM dicoumarol.

