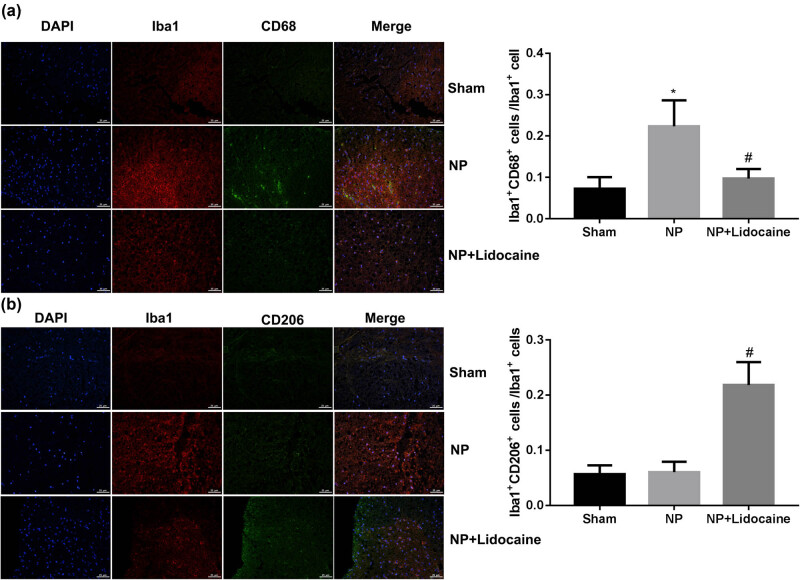
Figure 2.
Lidocaine regulated M1/M2 microglial polarization in a rat model of CCI-induced NP. The rats in different groups were sacrificed at 14 days, and L4–L6 segments of the rat spinal cord were separated. Representative images of immunofluorescence assay were used to detect the microglia marker Iba1, M1 marker CD68, and M2 marker CD206 to quantify the number of M1 (a) and M2 microglia (b). DAPI (nuclei, blue), total microglia (Iba-1, red), M1-microglia phenotype (CD68, green), and M2-microglia phenotype (CD206, green). Data are expressed as mean ± SD and were analyzed using one-way ANOVA with Tukey’s post hoc test. *p < 0.05 versus Sham group; #p < 0.05 versus NP group.

