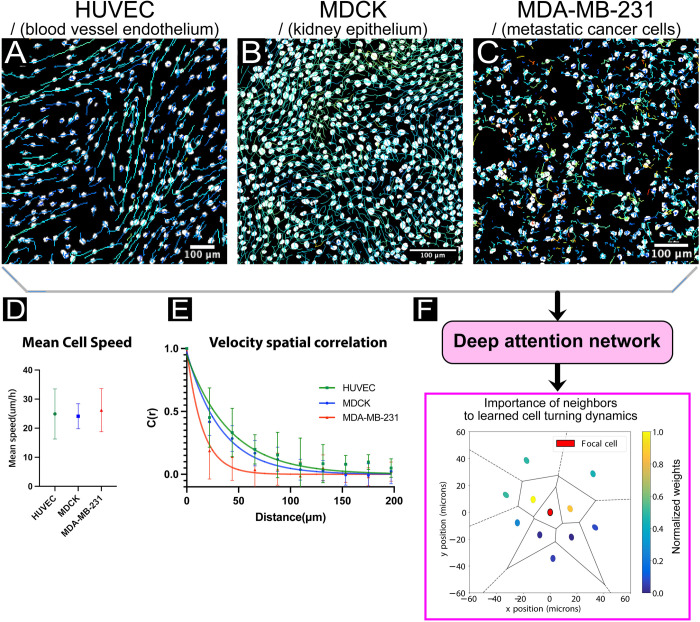
Fig 1. Cell trajectory data reveals collective rules.
(A, B, C) Representative cell trajectories within living tissues, from human umbilical vein endothelial cells (HUVEC), Madin-Darby Canine Kidney cells (MDCK), and epithelial, metastatic human breast cancer cells (MDA-MB-231), respectively. All three cell lines exhibit visually distinct dynamics: the HUVECs tend to have strongly correlated and directed leader/follower behavior; while MDCKs exhibit more complex coordination patterns and lack the directedness of HUVECs (e.g. see [23]); and the MDA-MB-231’s lack coordination with neighbors. Scale bars are 100 μm. See S1–3 Movies. (D) Classical collective analysis techniques reveal some group characteristics, such as mean speed or (E) velocity cross-correlations. (F) Deep attention networks trained on cell trajectory data can directly reveal new types of collective information, such as the learned relative influence of neighboring cells to forward motion of a focal cell. Here, the agents in front of the focal cell have higher weights, W (see Eq 1), with relative directions determined by agent trajectories. Cell position is representing using nuclei centroids and black lines indicate Voronoi cells (see Methods).

