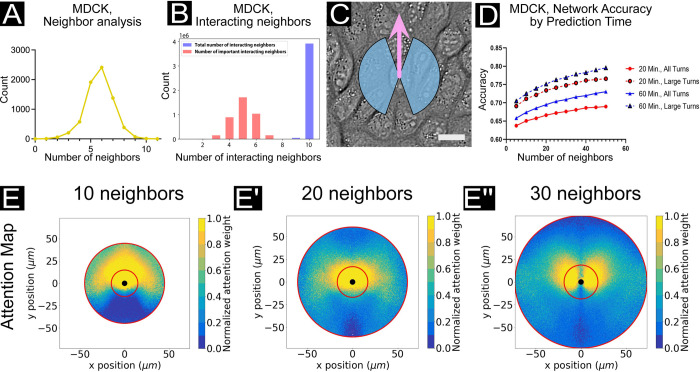
Fig 3. Local vs. long-range interactions in MDCK epithelia (bulk regime).
(A) The number of nearest neighbors based on an analysis of 1165 cells using the ImageJ/FIJI [47] BioVoxxel plugin [48] (see Methods). A peak can be observed at 6 nearest neighbors. (B) Histograms of total interacting cells (blue) and “important” interacting cells (red), as determined by a function utilizing the network aggregation weights (W) to estimate the most influential neighbors to learned focal cell dynamics. (C) A snapshot of MDCK cells with blue region indicating the extent of “large” turns (±20–160°) according to the focal cell trajectory, as indicated by the pink arrow. Scale bar represents 20 μm. (D) Network accuracy plots as prediction time and number of input neighbors is varied. Solid lines reflect accuracy scores for all turning angles in the focal agent trajectory; dashed lines reflect only large turns (±20–160°, see C). Accuracy increases with both number of neighbors encompassed by the network and prediction time. Cell trajectory timesteps were fixed at 10 minutes. (E, E’, E”) Attention maps for networks encompassing 10 (E), 20 (E’), and 30 (E”) neighbors. Plots shown here are analogous to Fig 2C’, with cell trajectory timestep of 10 minutes. As the number of neighbors taken into consideration by the network increases, a wider spatial range of interactions may be considered for forward motion prediction. With an increased range from which dynamic information can be directly captured from neighboring agents, we can observe shifts in learned relative influence of neighbors; for example, as longer-range neighbors provide richer information pertaining to dynamic shifts in the forward direction than immediate forward neighbors. See S9 Fig for the matching study in HUVEC endothelial cells.

