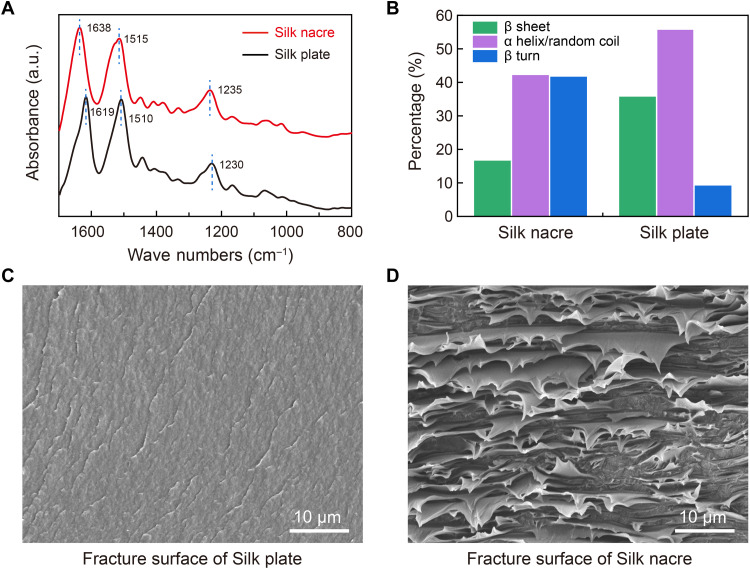
Fig. 3. Comparison of protein conformation and fracture morphology between silk plate and the Silk nacre.
(A and B) Analysis of FTIR spectrum shows lower β sheet content of the Silk nacre than silk plate. a.u., arbitrary units. (C and D) SEM images of the fracture cross sections indicate totally different fracture mechanisms between silk plate and the Silk nacre.

