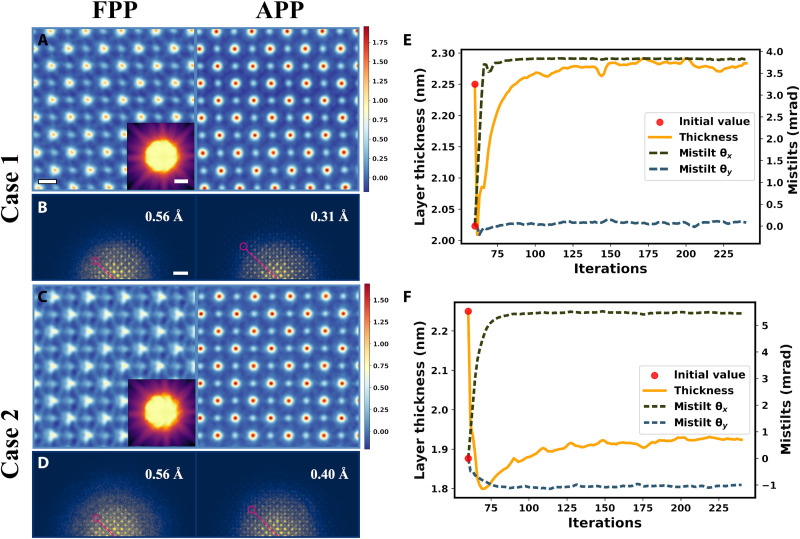
Fig. 3. Reconstruction via FPP and APP on experimental datasets with misorientation.
(A and C) Phase images averaged over slices recovered with FPP after post-alignment (left) and APP (right). Scale bar, 2 Å. The insets are PACBEDs. (B and D) Diffractograms corresponding to (A) and (C). Scale bar, 1 Å−1. (E and F) APP optimization processes of mistilt and thickness corresponding to case 1 and case 2, respectively.

